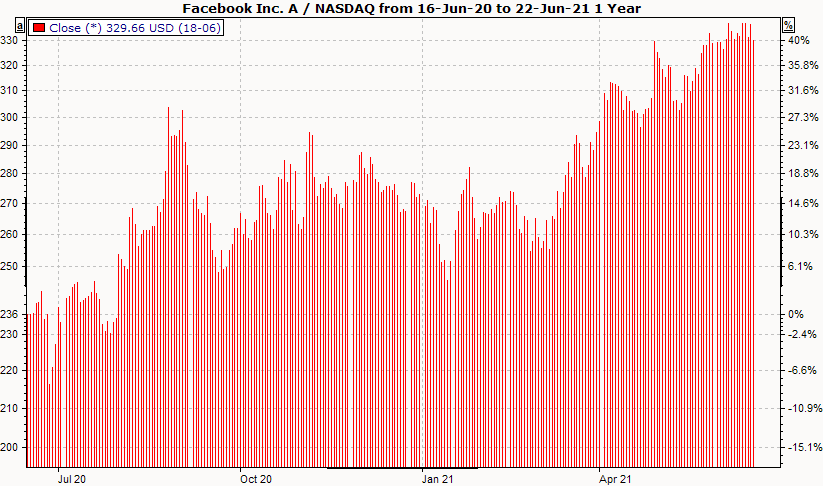
Interpretation of the histogram
Histograms are the usual form of representation for sales, but this representation is also generally chosen for some indicators. A bar is drawn up to the height of the price.
Display histogram
-
To display a time series as a histogram, select the price trend.
-
In the context menu of the selected time series, select the DARSTELLUNG, HISTOGRAM command.
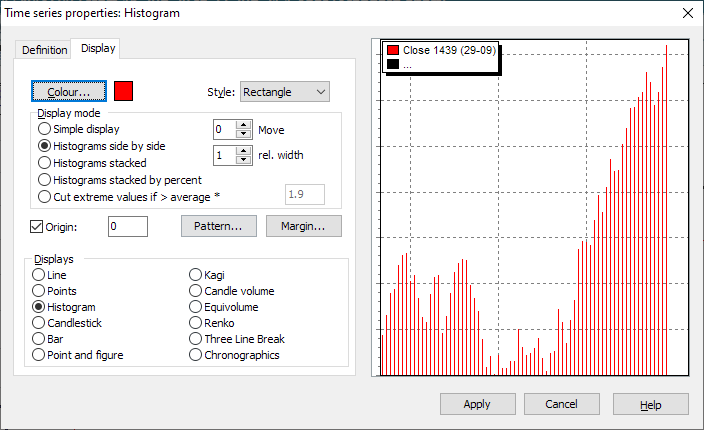
Histogram settings
To change the settings, select the time series and choose the command TIME SERIES... from the context menu
Here the positions differ slightly depending on which chart form was selected. The general positions (color, scale assignment, etc.) are described in the section Line chart and general settings , the special settings for histograms can be found here.
|
Field |
Description |
|---|---|
|
Style |
Here you can select a style from the list for the histogram displayed (rectangle, pyramid, etc.). |
|
Display mode |
In the "Display mode" field, specify whether the histograms are to be displayed side by side or stacked. Here you also have the option of clipping extreme values in the display that exceed the average value by a certain factor to be entered by you. If necessary, optimize the display of the histograms using the input fields "rel. Width" and "Shift" input fields. Experiment a little with these settings to achieve the optimum display for you. |
|
Origin |
Defines the reference to the zero line (usually 0). |
|
Sample |
Assign a pattern to the histograms using this button if you wish. |
|
Edge |
Determine the line properties of the border here. |