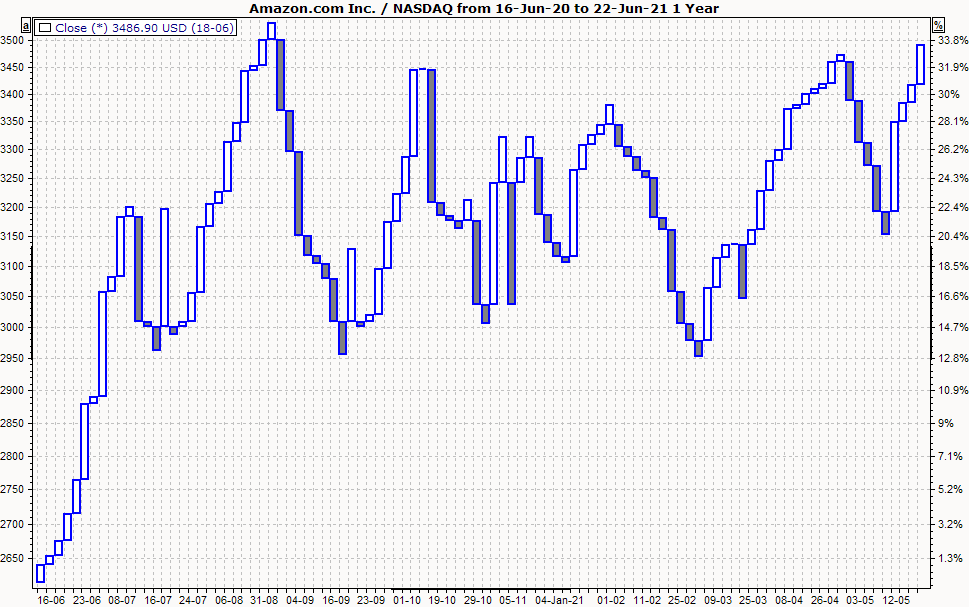
Interpretation of the three-line break chart
The three-line break chart consists of vertical blocks ("lines") based on price changes. As the name suggests, the three-line break chart usually consists of three lines. When drawing the blocks, the current close price is compared with the high and low of the previous day.
A new white block is drawn in a new column if the current closing price (close) exceeds the highest price of the previous day. A new gray block is drawn when the current closing price is below the previous day's low. If the closing price is within the range of the previous block, the subscription is not continued.
By default, after the display of three consecutive white blocks, the lowest closing price of these three blocks must first be undercut in order to draw a gray block. Conversely, if there are three consecutive gray blocks, the highest price of the last three blocks must first be exceeded in order to draw a new white block.
Three-line break charts are displayed independently of the time axis.
As a rule, a sell signal is given when three consecutive white blocks are followed by a gray block; and a buy signal is given when three consecutive gray blocks are followed by a white block. If white and gray blocks alternate, one assumes a "trendless" market and should not trade.
Display three-line break chart
-
To display a time series as a three-line break chart, mark the price trend.
-
Then select the SHOW, THREE LINE BREAK command in the context menu.
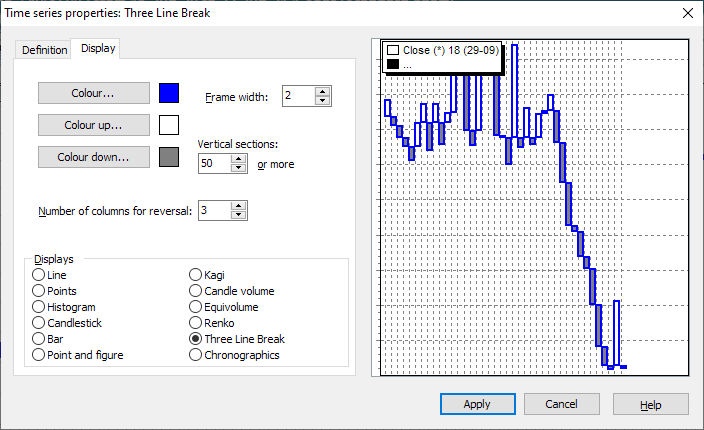
Settings of the three-line break chart
Make settings in the "Time series properties" dialog box. You can change these options by clicking on the corresponding fields or checkboxes.
|
Field |
Description |
|---|---|
|
Color upwards Color down |
Set the colors for the blocks here. |
|
Vertical sections |
Enter the minimum number of vertical sections to be displayed in the chart window here. |
|
Number of columns for reversal |
Specify here after how many "line breaks" the next block is to be drawn (i.e. the number of "lines"). For a short-term analysis, for example, you can enter just two line breaks to obtain more blocks, or four or more lines for a long-term analysis to reduce the number of blocks. The most common variant is three lines - as the name of the chart form suggests. |