In addition to the price representation as a line chart, i.e. the usual representation for the normal price trend, the Infront Portfolio Manager can also use other forms of representation, e.g. histograms, candlesticks, point-and-figure charts or Kagi and Renko charts.
The various display formats help you with your analyses or provide signals directly.
By default, you will already find the most common chart forms as worksheets in the securities workspace.
You can access these chart forms (candlestick chart, bar chart, etc.) by clicking on the relevant tabs.
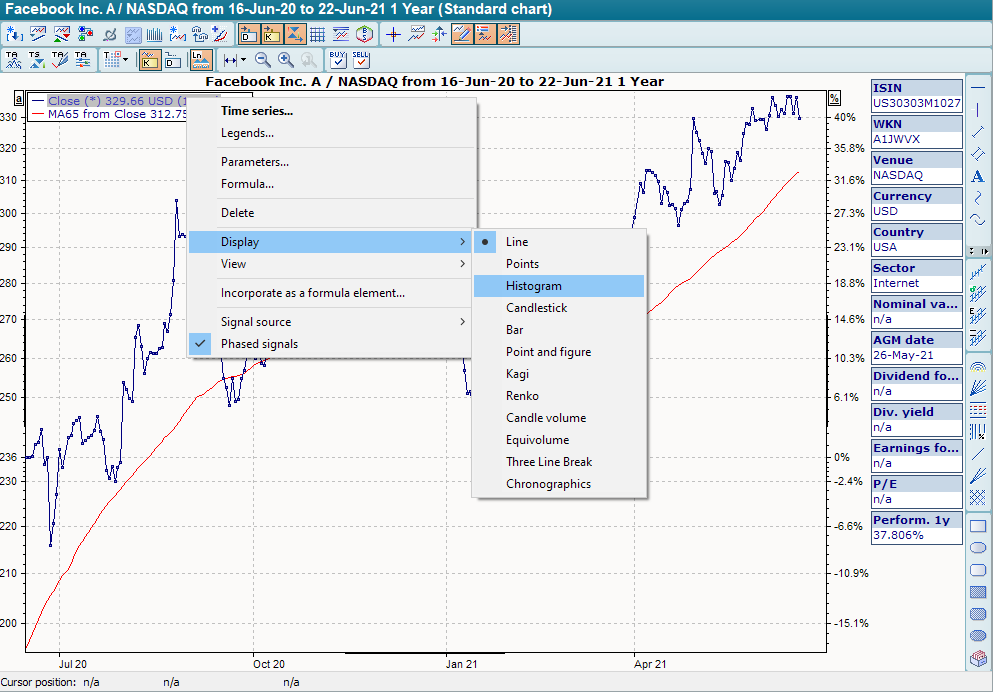
The quickest way to access other chart forms is from the context menu of the price history. To do this, select the time series in the legend and select the DARSTELLUNG command.