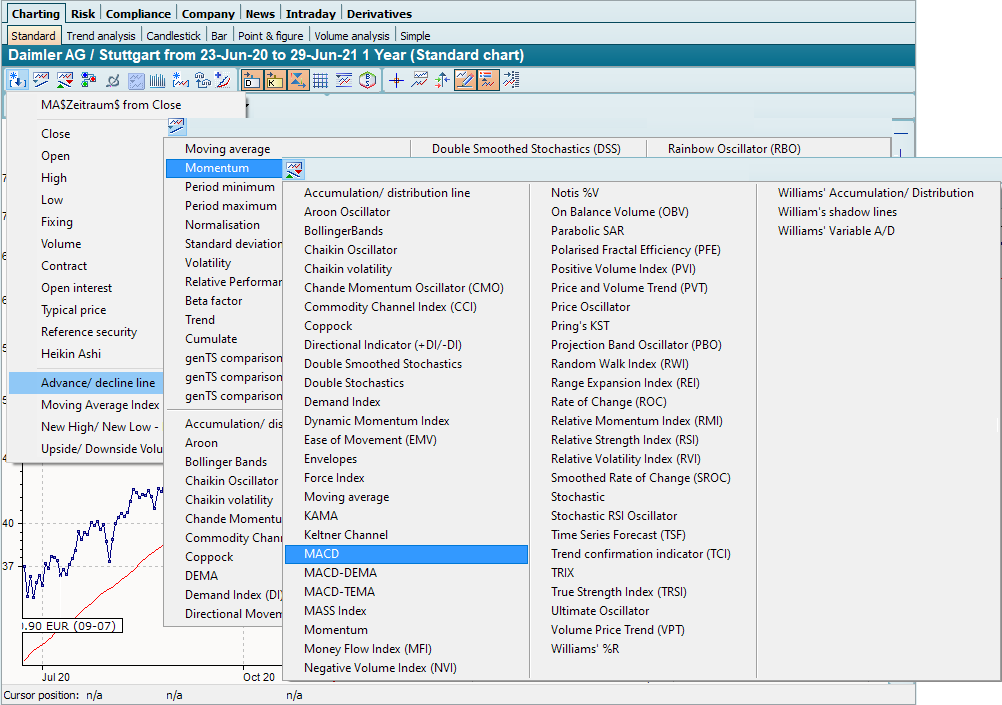
In the Infront Portfolio Manager, you can use the "Show new time series" and "Show base trading system" icons in the chart window to display predefined time series or base trading systems in a chart. You can use the "Show indicator" icon to apply predefined time series functions to time series that have already been shown. These formula splits are therefore placed after the formula of the selected time series when used in the chart, i.e. linked to the predecessor.
![]()
![]()
![]()
You can define which functions are contained in the pull-down menus yourself.
The entries in the pull-down menus are user-dependent. In a network installation, each user only ever sees the standard entries and the entries they have configured themselves.