Your Infront Portfolio Manager offers you a wide range of options for designing charts. In addition to the various display formats (e.g. line, candlestick or point-and-figure charts), you can also show comparative values, over 70 indicators or draw your own trend lines or texts.
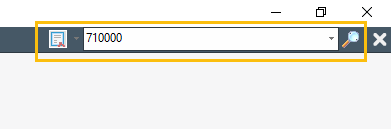
The search field in the ribbon is the easiest way to open a chart. Select the securities via the object search and open them. You will find many different chart templates in the securities workspace. These and other options for opening charts are described in detail later in this chapter.
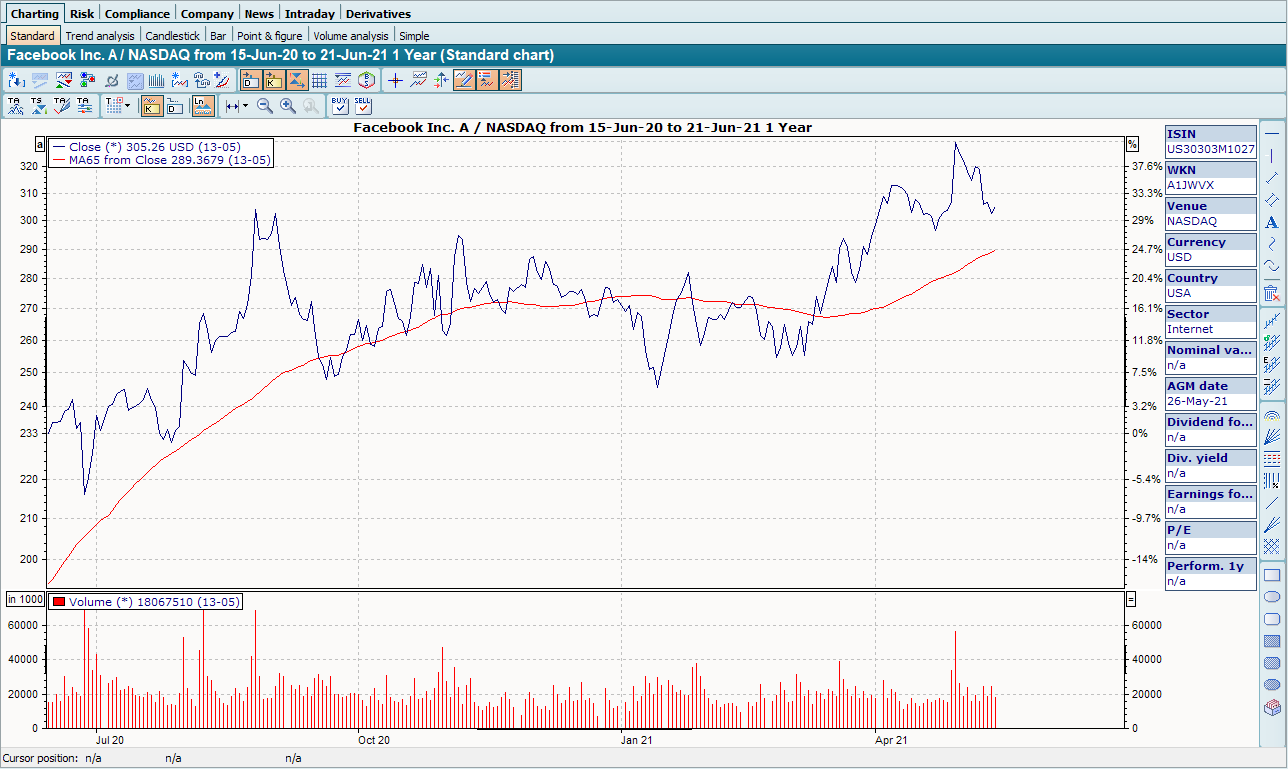
As soon as you call up a security chart, various worksheets (tabs) with chart templates are displayed in the workspace of the security under the "Charting" worksheet.
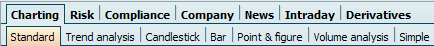
By clicking on these tabs, you can access the most important chart functions for the current security, e.g. the trend analysis chart and other chart forms (bar chart, candlestick chart, etc.). Or you can switch to the intraday area via another worksheet.
All important functions are available as icons on the toolbar of the chart window, via the "Chart" tab in the ribbon or via the context menu (right mouse button) directly in the chart.
The Infront Portfolio Manager can display all securities for which prices are available. These can of course also be bonds, futures, economic data, etc. The same applies to the technical interpretation of these charts as to stock charts. The only exceptions are warrants, which are treated separately.
-
Open charts -
Chart window -
Edit charts -
Price data in charts -
Save charts -
Print charts -
Export charts -
Drawing functions -
Chart forms -
Intraday chart -
Long-term chart -
Comparative values -
Technical indicators -
Basic trading systems -
Signal performance in charts -
Chart show -
Chart gallery -
Chart default settings -
Working with price time series in the chart -
Chart form elements