Skip table of contents

Long-term chart

To display a long-term chart in addition to an open securities chart, click on the "Long-term chart" icon.

The long-term chart is displayed in a separate window in addition to the current price trend. It contains all available historical prices for the current security.

The period shown in the chart window is marked in red.

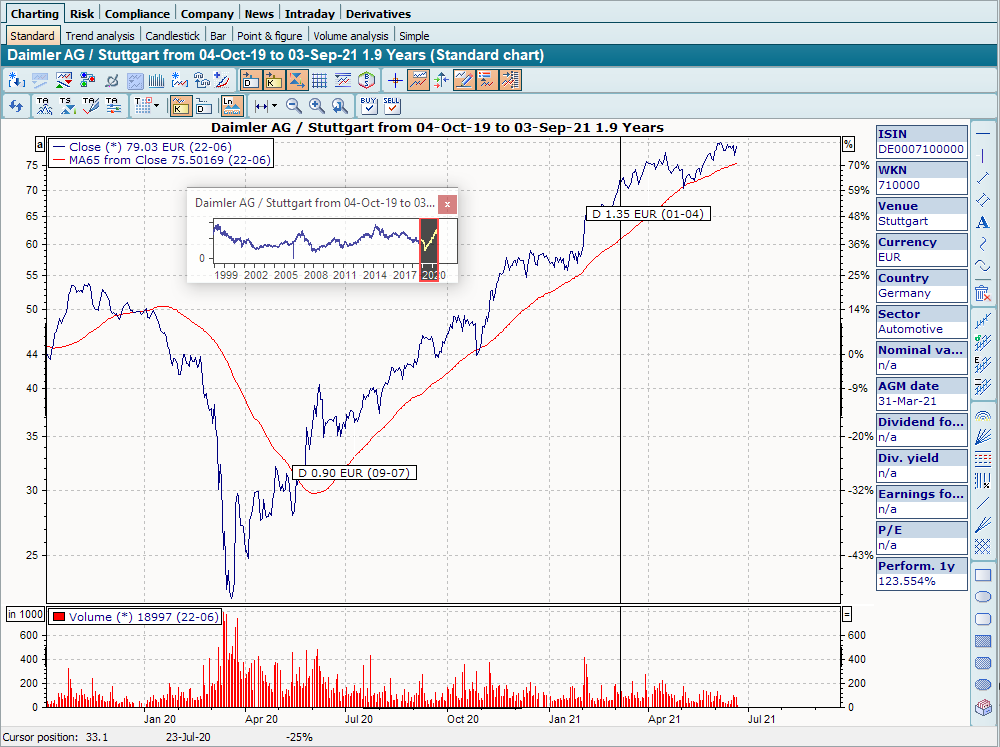
The window with the long-term chart can be moved to the title bar within the chart window with a mouse click (by holding down the left mouse button).

To hide the long-term chart again, select the "Close" icon in the top right-hand corner of the window with the long-term chart.

JavaScript errors detected

Please note, these errors can depend on your browser setup.

If this problem persists, please contact our support.