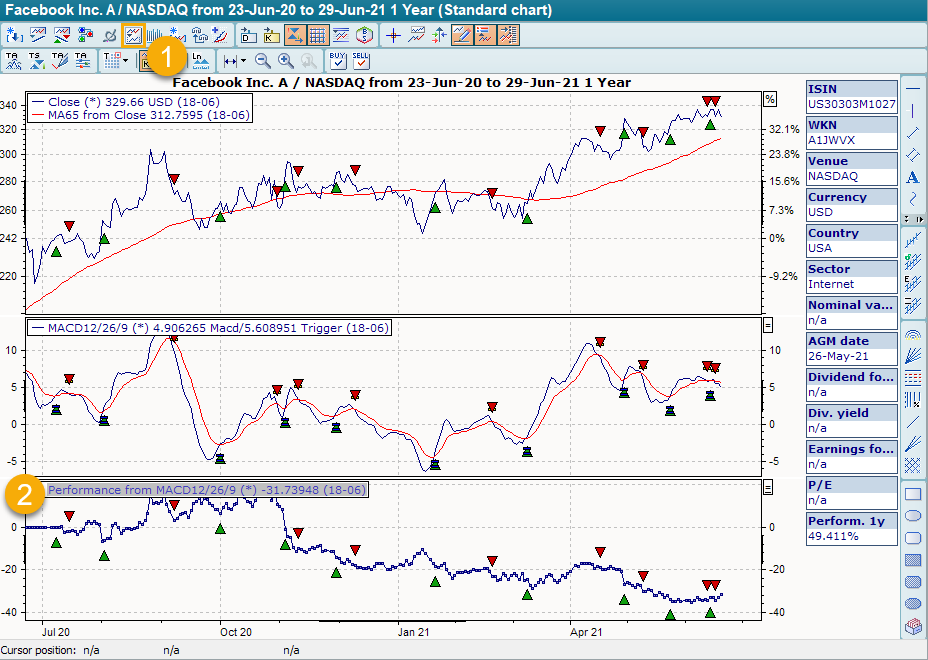
Especially for testing purposes, it is important to see what a trading system or signal system has achieved in the past.
If you change the parameters, you will immediately see the effect.
![]()
Would you like to see the performance for all securities in the signal system folder? Call up the SIGNAL-PERFORMANCE worksheet (on the SIGNALE worksheet) in the workspace of the signalling system. The Infront Portfolio Manager then calculates the performance for all securities contained in the input object.