The Infront Portfolio Manager offers you countless possibilities to customize chart evaluations. For example, you can insert indicators, comparative values or sales, edit the background, change the font or change individual properties of the time series.
You can access most commands via the context menu of the price history or the icons in the chart window. Alternatively, you can also find all functions in the ribbon on the "Chart" tab when charts are open.
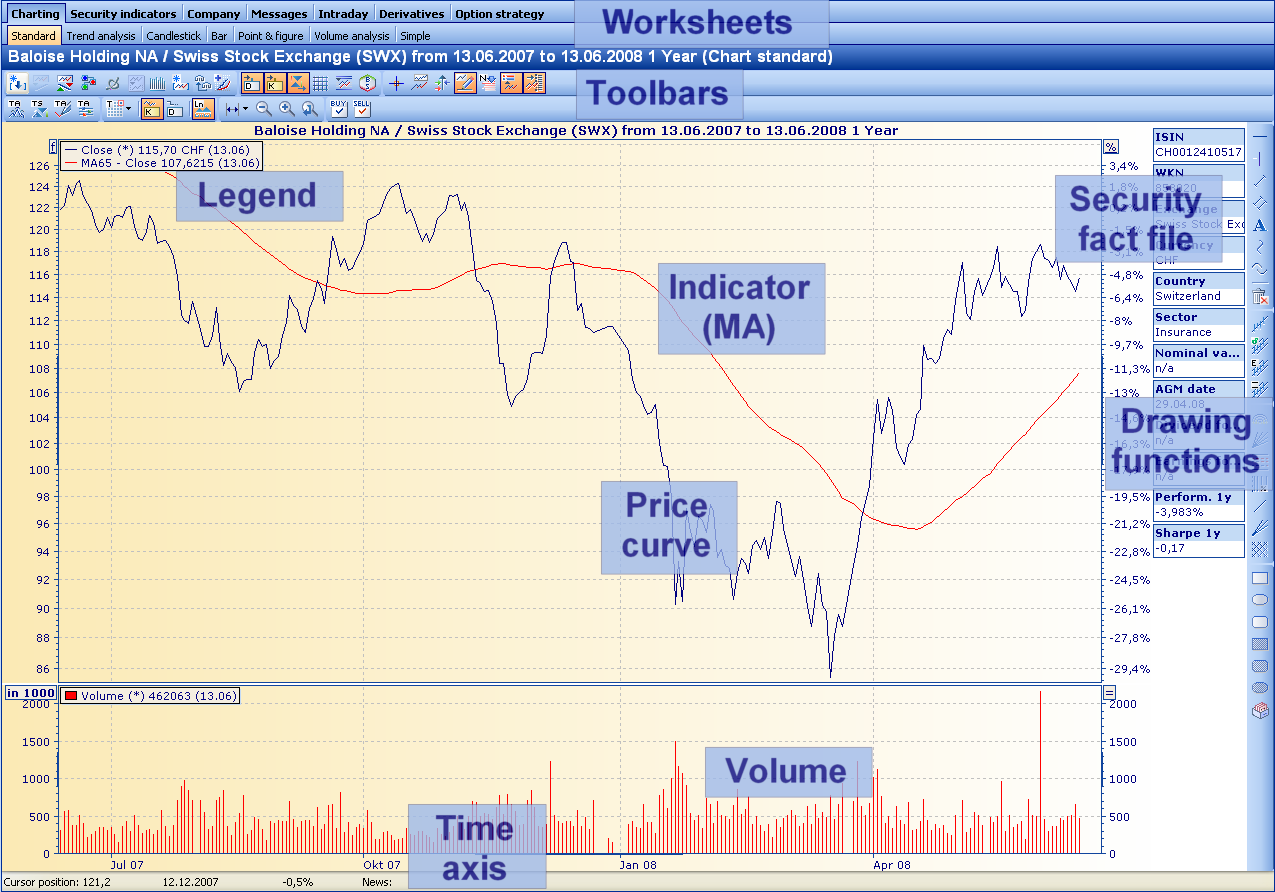
The area in which the price trend is shown is called the chart. Turnover (as well as some indicators and trading systems) are shown in separate charts.