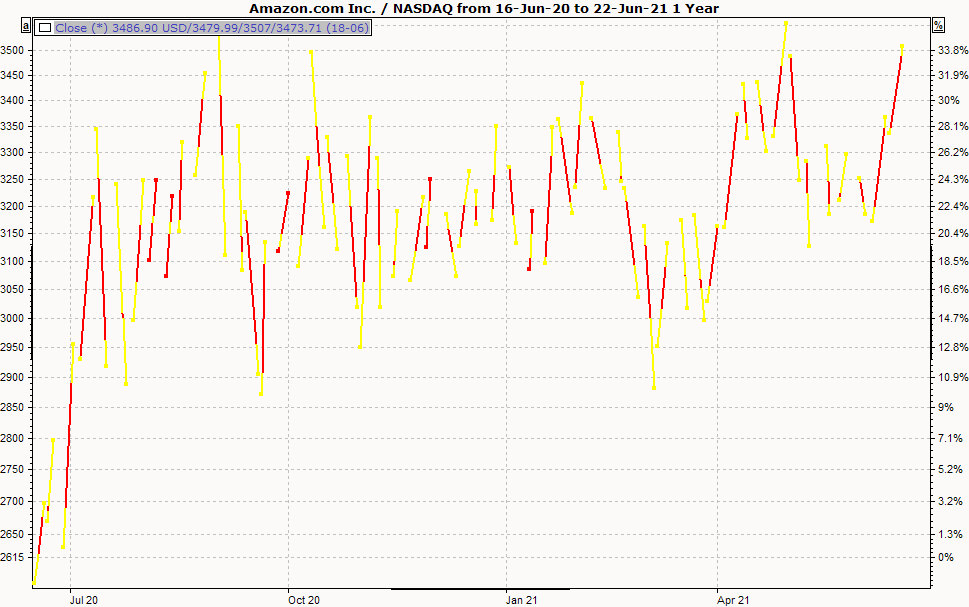
Interpretation of the Chronographics
Chronographics are a new, not only visually very interesting chart form that the Infront Portfolio Manager makes available to you. The chart consists of a line for each of the time periods selected in the "Time series properties" dialog box. The lines represent the distance between high and low in the period.
The inner part, which should be displayed in a different color, represents the distance between Open and Close. It is therefore conceivable that there are many different lines in terms of inclination angle and length depending on the degree of aggregation over time, and the possibilities for interpretation are correspondingly unlimited.
Intervals are described as "degenerate" if either the high occurs before the low, although the open price is below the close price, or the high occurs after the low, although the open price is above the close price.
Display Chronographics
To display a chart as chronographics, select the time series. And then select the SHOW, CHRONOGRAPHICS command in the context menu.
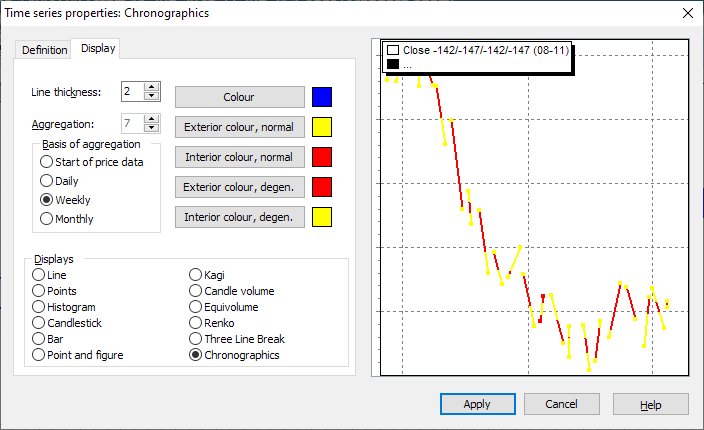
Chronograph settings
Make settings in the "Time series properties" dialog box. You can change these options by clicking on the corresponding fields or checkboxes.
|
Field |
Description |
|---|---|
|
Line thickness |
Select here how thick the lines should be displayed. Check the changes in the window on the right. |
|
Color |
Opens a dialog box in which you can change the basic color of the chart. If you later switch from the chronographics display to the line display, for example, the chart will be drawn in this color. |
|
Aggregation basis |
Defines the time periods to be considered. If "daily" is selected, a line with high, low, open and close is drawn for each trading day. Accordingly, 7 days are summarized for "weekly" aggregation and 31 days for "monthly" aggregation. To determine an individual level of aggregation, activate the "Start of courses" option and specify the desired number of days in the "Aggregation" field. |
|
Outer colors Inner colors |
To the right, you can determine the colors of the lines. Select the respective button to select the desired color for the inner and outer lines in the familiar dialog windows. You can also display degenerate values in other colors. Take advantage of this opportunity, as intervals with degenerate values generally indicate lively trading activity in different directions. A good indicator for the reversal of a trend. |