Interpretation of the points chart
Another form of representation is the point representation. A point is drawn here for each course. Various symbols are available for the point.
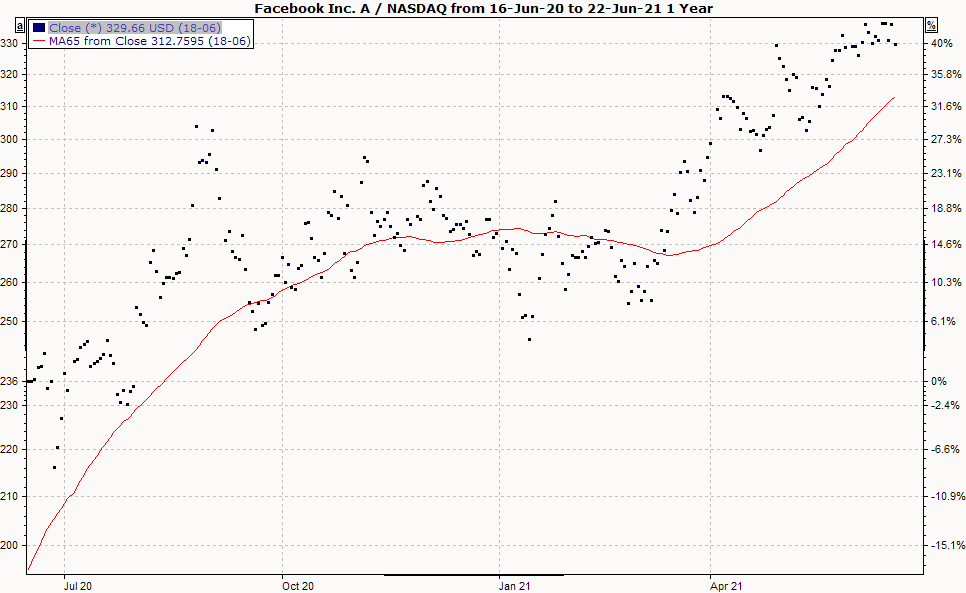
Display points chart
To display a time series as a point chart, select the price trend and choose the command DISPLAY, POINTS from the context menu.
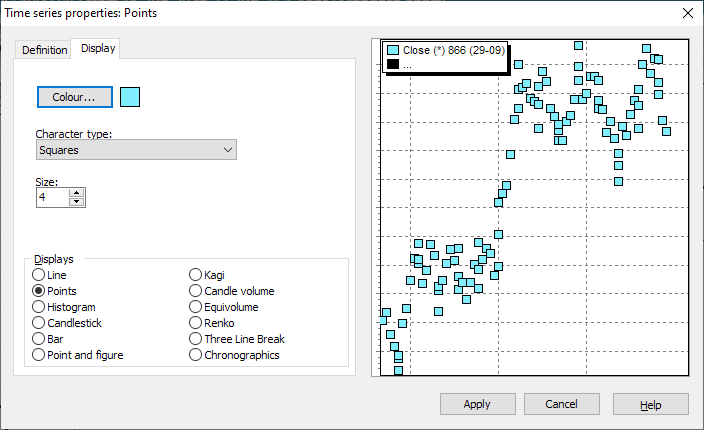
Settings of the points chart
To change the settings, select the time series and choose the command TIME SERIES... from the context menu.
The positions differ slightly here. Depending on which chart form was selected. The general positions (color, scale assignment, etc.) are described in the section Line chart and general settings , the special settings for the point display can be found here.
You can see the consequences of your changes immediately in the window on the right.
|
Field |
Description |
|---|---|
|
Character type |
You can select the type of characters for the points chart from the list (square, circle, triangle and various others). |
|
Size |
Here you define the size of the symbols. You will immediately see the change on the right-hand side of the dialog. |
|
Representation |
You can also select a different chart form in the "Display" area. |