Proceed as follows to draw trend channels in a chart:
-

The two lines run parallel to each other. -
You can use the gray boxes to change the inclination of the bottom line and drag the lines to the desired position.
-
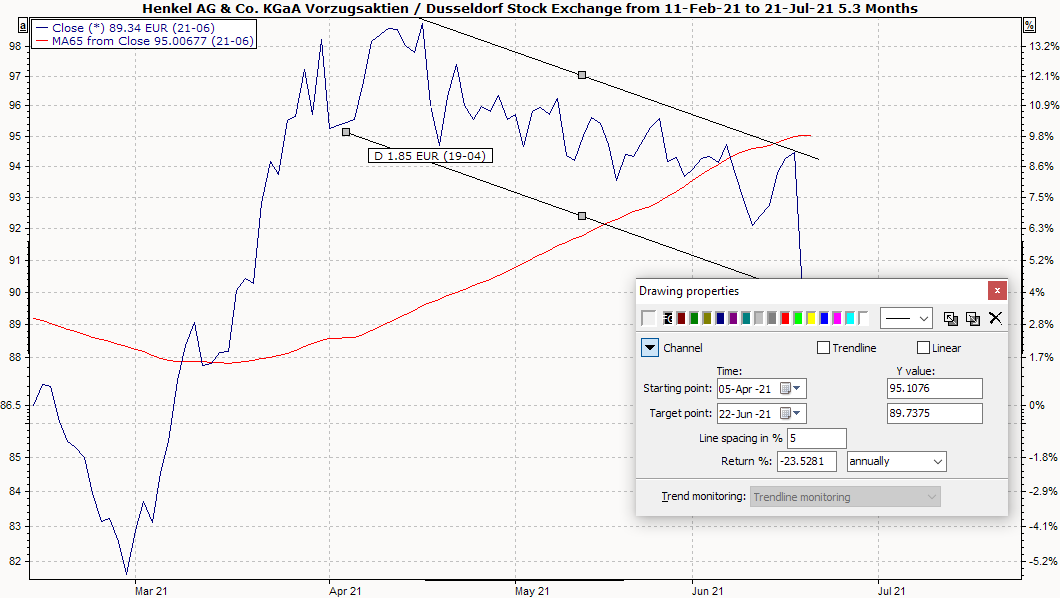
Do you want the trend channel to continue? Then activate the "Trend line" checkbox that appears after drawing the trend channel.
-
You can "draw" the trend channel precisely by entering the exact data for the course of the channel in the fields under "Time" and "Y value".
-
Assign your trend channel to an automatic trend line monitoring (previously defined in the Explorer). Read the following chapter on trend line monitoring.