Proceed as follows to insert drawing elements into charts:
-
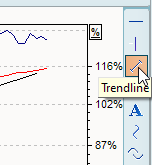
Open a chart and click with the mouse on the corresponding icon, for example a line.
-
Move the mouse pointer to the point where you want your drawing to start and drag the mouse pointer to the end point of the drawing while holding down the left mouse button.
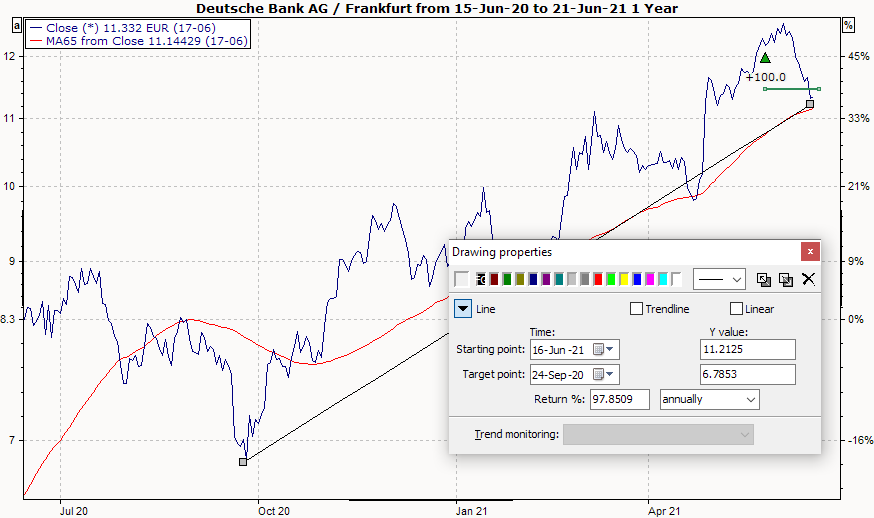
The dialog window with the drawing tools appears as soon as you release the left mouse button. -
Make further settings if necessary. For example, to define a trend line, activate the "Trend line" checkbox so that the line continues to be drawn.
-
Use the gray and white boxes to change the position or size of the drawing.
-
You close the window using the "Close" icon in the top right-hand corner of the window. The drawings remain intact.
-
When the chart window is closed, the subscriptions for this security are saved.