The standard deviation is a value for measuring the volatility of a value. Standard deviation channels are represented by drawing two parallel lines above and below a regression line. The lines have a certain distance from the regression line (standard deviation).
Proceed as follows to draw a standard deviation channel in a chart:
-
First mark the price trend.
-
Unknown Attachment Select the "Standard deviation channel" icon.
-
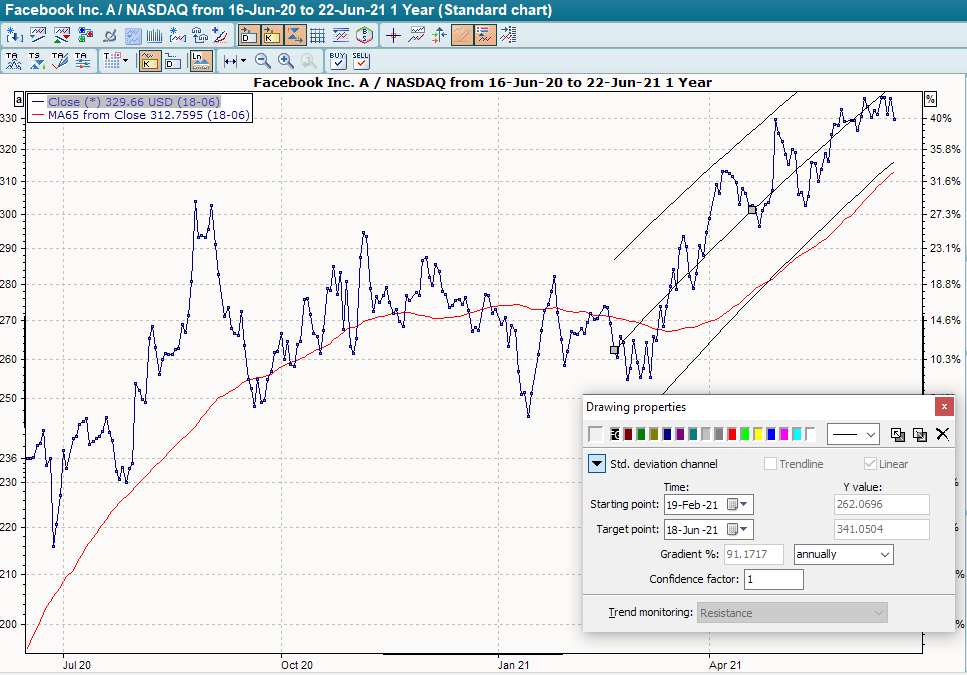
Draw the channel in the chart while holding down the left mouse button.
-
You can move the line slightly using the gray markings.
You can also enter the exact start and end points in the "Character properties" dialog box. You can also see the percentage increase in the displayed interval (annually, monthly or daily).
You can change the value of the standard deviation in the "Confidence factor" field. The distance between the lines is then changed accordingly.