Proceed as follows to insert a new time series into a chart:
-
Use the search field to open the workspace of a security and a chart there.
-

The high price is shown in the chart window in addition to the standard close price.
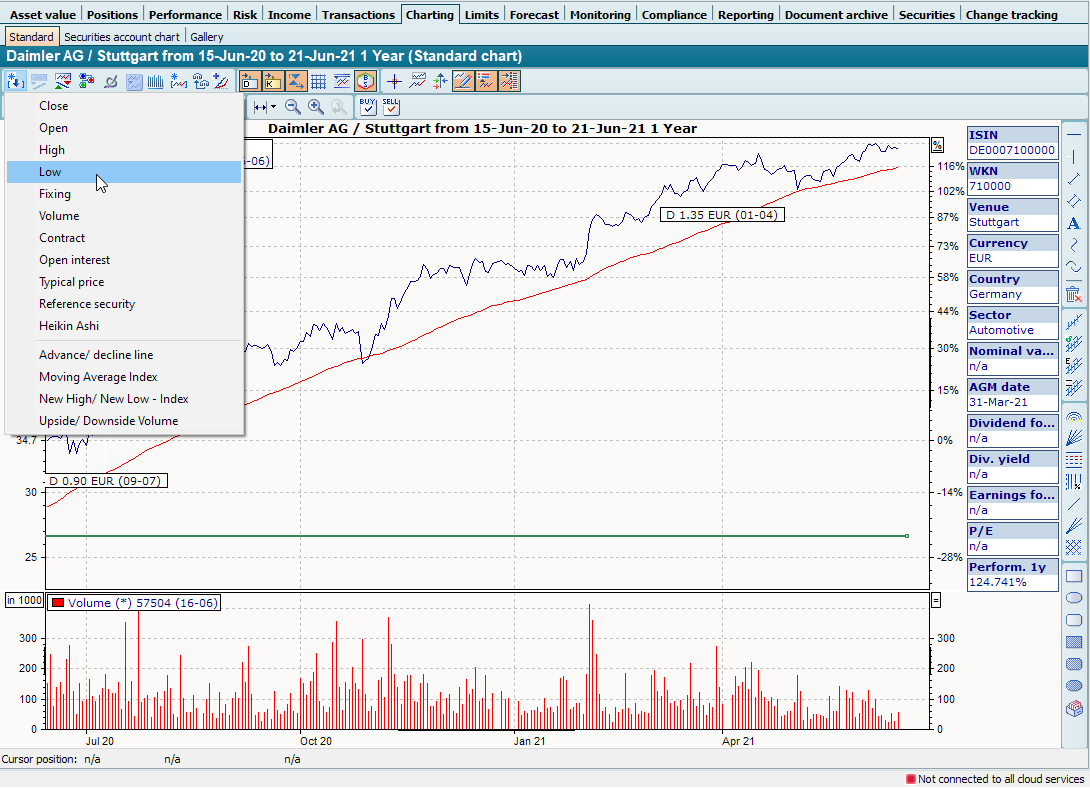
This allows you to display several price time series for a security.
High, low, spot prices etc. are not provided for all securities. Which courses are available depends, among other things, on your course data subscription.