This evaluation provides both a table and a graphic for visualizing the negative elasticity, which opens by default. Use the familiar tabs at the bottom of the evaluation window to switch between table and graph view. You can find the evaluation in the securities workspace on the "Risk" worksheet.
In order to make meaningful use of this evaluation, a comparative value must be stored for the fund (or security) to be analyzed. You can use the parameters (<CTRL>+<A>) to select a benchmark for the evaluation. The benchmark selected here may be used in this evaluation instead of the one assigned in the master data. To calculate the data points and the regression line, read the section Basic key figures as individual key figures for an evaluation date.
The corresponding table contains the following columns:
|
Column |
Description |
|---|---|
|
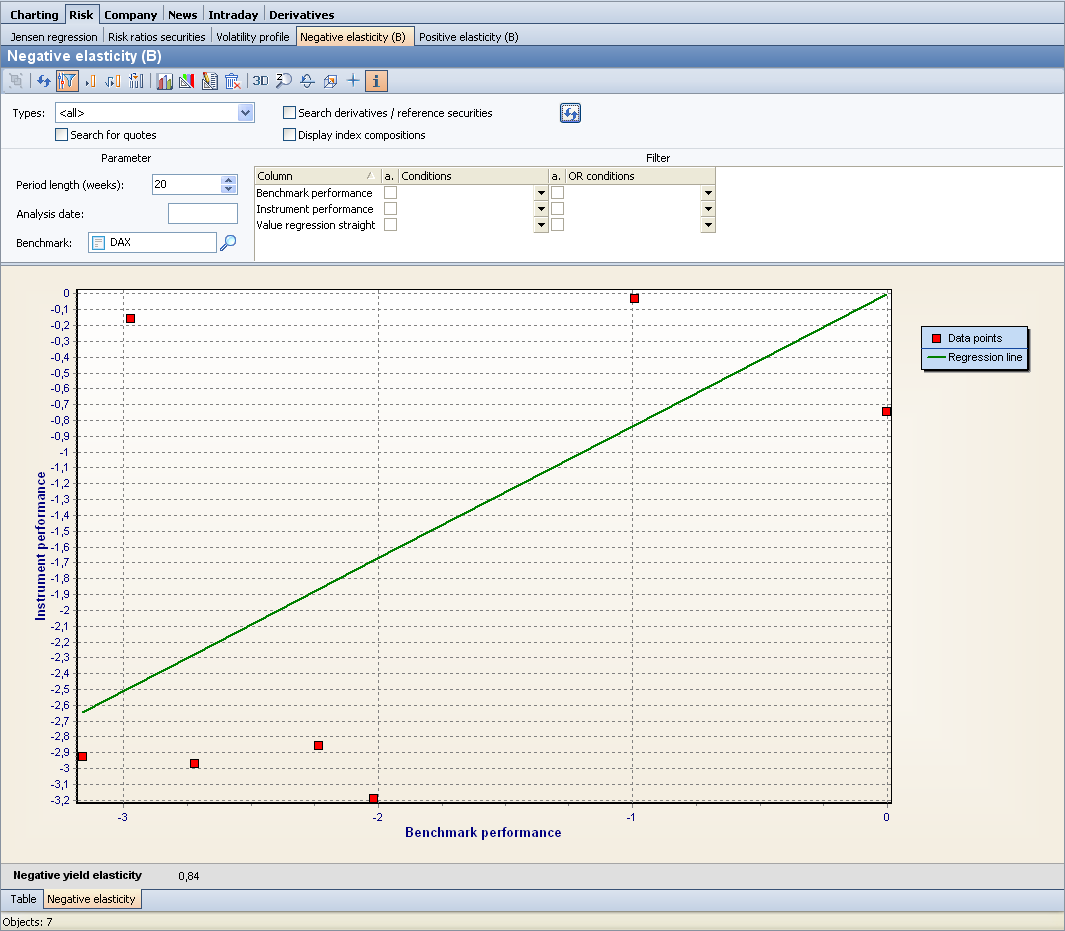
Benchmark performance |
The performance of the comparative value, shown on the horizontal axis in the chart. |
|
Instrument performance |
The performance of the security, shown in the chart on the vertical axis. |
|
Value Regression line |
This column provides the points on the regression line resulting from the calculation (negative elasticity * benchmark performance). |