This evaluation provides both a table and a graphic for visualizing the Jensen regression for portfolios, which opens by default. Use the familiar tabs at the bottom of the evaluation window to switch between table and graph view. You can find the evaluation in the workspaces of holders, portfolios and custody accounts on the "Risk" worksheet, "Risk figures".
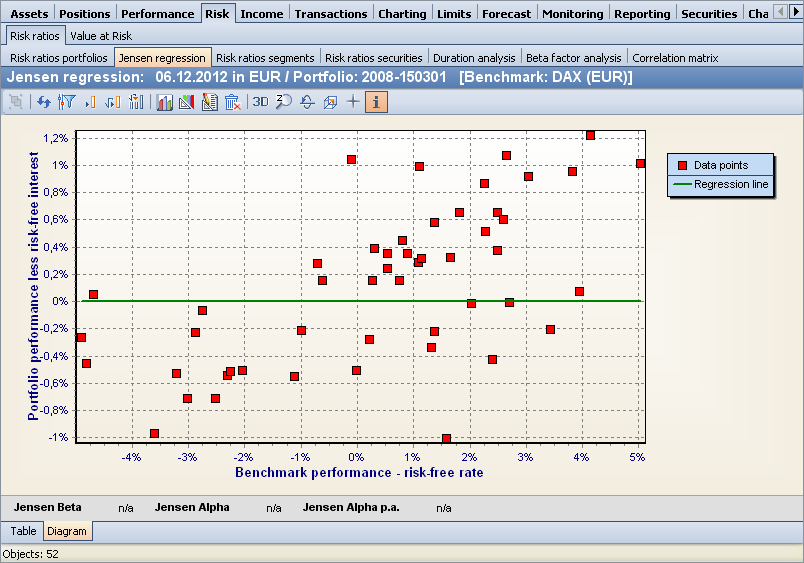
In order to make meaningful use of this analysis, a benchmark must be assigned to the portfolio to be analyzed. You can use the parameters (<CTRL>+<A>) to select a benchmark for the evaluation. The benchmark selected here may be used in this evaluation instead of the one assigned in the master data. To calculate the data points and the regression line, read the section Portfolio theory and risk.
The evaluation only makes sense on individual securities account objects, not on lists.
For securities, please visit Jensen regression security .
In the Jensen regression portfolio table you will find the following columns and footer fields:
|
Column |
Description |
|---|---|
|
Date |
The respective date of the data point. |
|
Benchmark performance less safe interest rate |
The performance of the comparative value, shown on the horizontal axis in the chart. |
|
Instrument performance less secured interest |
The performance of the security, shown in the chart on the vertical axis. |
|
Value Regression line |
This column provides the points on the regression line resulting from the calculation. |
|
Jensen beta |
The Jensen beta can be interpreted as a measure of risk and measures the dependence of the risk-adjusted return on securities on the risk-adjusted benchmark return. |
|
Jensen-Alpha |
The Jensen alpha can be used as a measure of management performance in relation to the risk-adjusted benchmark return. The rule is that a positive alpha implies outperformance. |
|
Jensen-Alpha p. a. |
Annualized Jensen-Alpha. |
If you point to the data points with the mouse, an info flag with the corresponding date will be displayed.