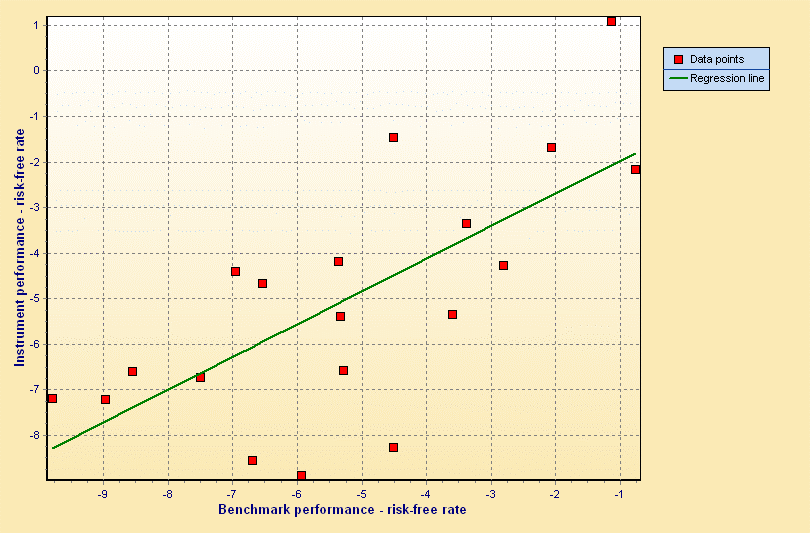
The CAPM (Capital Asset Pricing Model) can also be interpreted as a linear regression model and the Jensen alpha and Jensen beta regression coefficients can be calculated from it. As with the elasticities, you can choose whether to use the absolute or logarithmic returns as a basis (see also Preliminary remarks on the key figures in this main section).
ȓW-ȓF=β⋅(ȓB-ȓF)+α+ε
ȓF denotes the time series of the interest rate of a risk-free investment (constant in the period under review).
The aim here is also to minimize the error ε using the method of least squares, whereby data from n periods is also used as a basis. The formal solution is not presented here.
The regression coefficients α and β are referred to as Jensen alpha and Jensen beta.
Jensen-Alpha
The Jensen alpha can be used as a benchmark for the performance of the management (of a fund) in relation to the risk-adjusted benchmark return. The rule is that a positive alpha implies outperformance.
Jensen beta
The Jensen beta can be interpreted as a measure of risk and measures the dependence of the risk-adjusted return on securities on the risk-adjusted benchmark return.
Standard deviations or regression coefficients are always calculated over n periods; the return is always the annualized return.
Sharpe ratio
The Sharpe ratio is the quotient of the annualized excess return compared to a risk-free investment and volatility, i.e. it measures the excess return achieved per unit of risk.

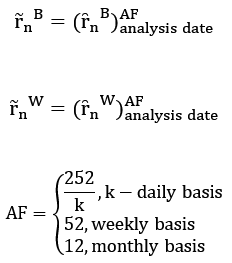
The number of periods between the start and end time depends on the set consolidation:
-
Daily (252 days a year)
-
Weekly (52 weeks)
-
Monthly (12 months)
Weekly consolidation and logarithmic returns are the default settings in the "Portfolio risk figures" report.
The risk-free interest rate can be configured for each currency in the Infront Portfolio Manager. If necessary, read the section Configure secure interest rates.
Calmar ratio
The Calmar ratio divides the annualized excess return by the maximum drawdown.

The Sharpe ratio has the weakness that it fundamentally regards volatility as something negative, so to speak, but in fact only that part of volatility that is calculated from negative price movements is undesirable. Unlike the Sharpe ratio, the Calmar ratio divides the annualized excess return not by the volatility but by the maximum drawdown. This approach was developed by Terry W. Young in 1991. Young was the owner of California Managed Accounts, which also published a newsletter called CMA Reports. "Calmar" is an acronym consisting of the company name and the newsletter title: CALifornia Managed Accounts Reports. If two funds achieve the same return, an evaluation of the Calmar ratio favors the one whose setbacks are less drastic.
In its pure form, the Calmar ratio has the disadvantage that it may put older funds at a disadvantage. For example, if you compare Russia funds that existed before the Russian crisis of 1998 with more recent funds that did not have to experience this crash, the more recent funds have an advantage. Technology funds that were active before 2000 are also not comparable with products issued after 2003. For this reason, in practice there is a modification of the Calmar ratio in which the maximum drawdown is calculated for the period of the last three years, so that the conditions are the same for all funds compared. Although particularly severe drawdowns are "lost" over the years, the Calmar ratio is still a good way of assessing the performance of fund managers.
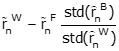
Modigliani measure
The Modigliani measure is the product of the excess return over a risk-free investment and the quotient of the volatilities of the benchmark and the security, i.e. it measures the excess return achieved relative to a benchmark as a percentage.
Treynor ratio
The Treynor ratio is comparable to the Sharpe ratio, although the β rather than the volatility is selected as the risk measure. It is therefore the quotient of the additional return compared to a risk-free investment and the Jensen beta.

Information ratio
The information ratio is the quotient of Jensen alpha and the tracking error, can therefore be seen as an extension of the Sharpe ratio, and provides an indication of how (with what outperformance) a deviation from the benchmark is rewarded.
