Module "Portfolio Service Extended Portfolio Analysis"
This evaluation, which is based on Risk-return diagram , focuses on a comparison with 1 to 3 general benchmarks. You set the benchmarks via the parameters; they are then also displayed as points in the diagram.
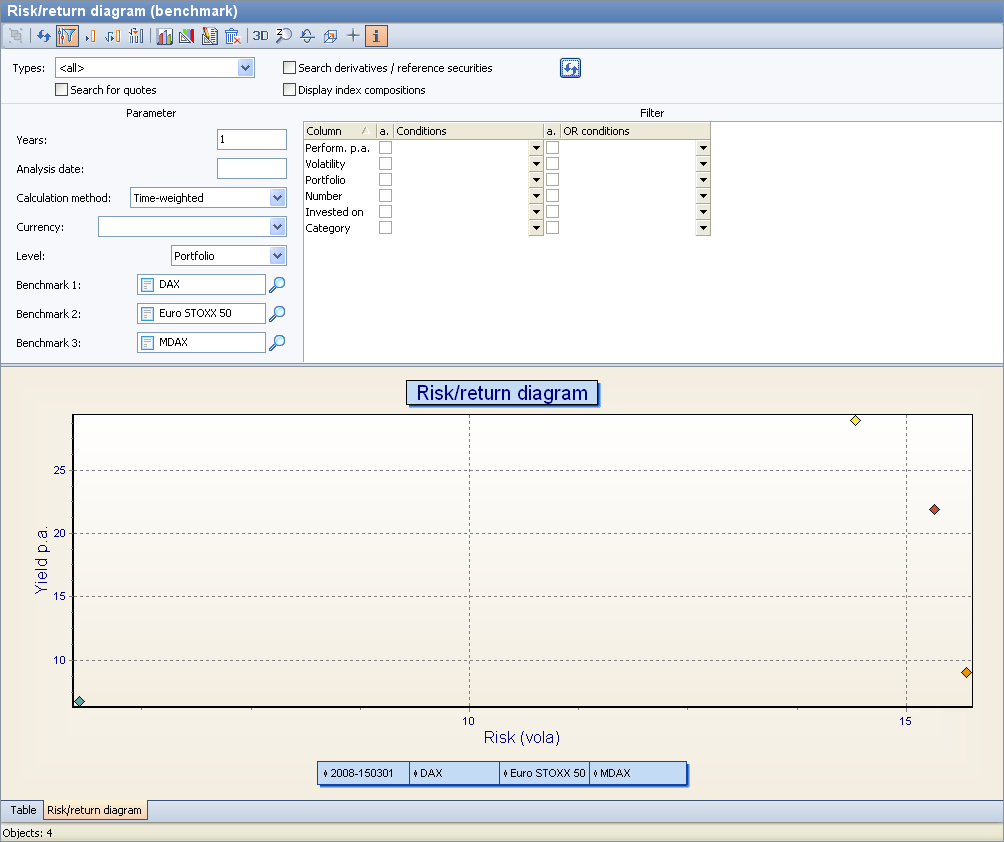
The dots in the diagram mark the portfolios or benchmarks (in the "Diamond" style by default). On the y-axis you can read the return p. a. (=performance) of the portfolio, on the x-axis the risk (=volatility).
Take the most important key figures for owners and benchmarks from the corresponding table:
|
Column |
Description |
|---|---|
|
Category |
The table is grouped by default according to this column - owner or benchmark. |
|
Portfolio,
|
Name of the portfolio, custody account or holder and the name of the benchmarks. Which depot objects are displayed depends on the setting of the "Level" parameter.
|
|
Number |
Here you will find the portfolio numbers for portfolios, the custody account number for custody accounts, the holder number for holders and the WKNs for benchmarks. |
|
Created on |
Date on which the portfolio was created according to the "Properties" dialog box. |
|
Performance p. a. |
The portfolio performance of each portfolio or performance of the benchmark per annum. The value corresponds to the return shown on the y-axis of the risk-return diagram (benchmark). |
|
Volatility |
Volatility corresponds to the risk that is plotted on the x-axis of the risk/return chart (benchmark). |