This analysis presents the key risk figures at portfolio level. You can find the evaluation in the workspaces of portfolios, groups or holders on the "Risk" worksheet, "Risk indicators"
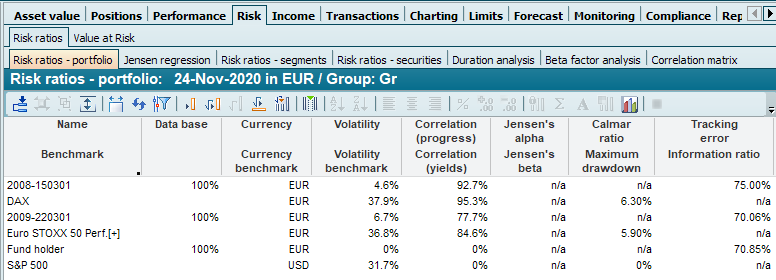
The columns of the "Risk indicators portfolio" report in detail:
|
Column |
Description |
|---|---|
|
Name |
The name of the holder (or portfolio or custody account). |
|
Benchmark |
The name of the holder's benchmark. |
|
Data basis |
The value in this column helps you to assess the reliability of the calculations, as it is an indication of the quality of the database. This percentage value is the number of courses (for the given consolidation) of the holder divided by the maximum possible number of courses in this consolidation. For owners, the "Created on" date is used here. If this is within the evaluation period, a value of less than 100 % is generally calculated, even for courses without gaps. Exception: In the global settings on the "Securities account" tab, the "Evaluate from 'Created on' date if the 'Created on' date is after the standard start time of the evaluation" checkbox is activated. For values below 80%, the data basis is generally considered to be poor. Also ensure that the parameters are set appropriately. If necessary, show the "Number of returns" column, which is hidden by default, to see the number of data points directly. |
|
Number of returns |
The number of return periods (data points) used in the calculation. |
|
Currency |
The currency of the holder (or of the portfolio or custody account). |
|
Currency Benchmark |
The currency of the benchmark. |
|
Safe interest (selection date) |
The safe interest rate of the holder's currency on the evaluation date. If necessary, read the section Configure secure interest rates. |
|
Safe interest benchmark (selection date) |
The safe interest rate of the benchmark currency on the evaluation date. If necessary, read the section Configure secure interest rates. |
|
Volatility |
The volatility of the portfolio. This corresponds to the risk that is plotted on the x-axis of the risk/return diagram. The annualization of volatility is set at 252 days. |
|
Volatility benchmark |
The volatility of the benchmark. This corresponds to the risk of the benchmark, which is plotted on the x-axis of the risk-return diagram. |
|
Correlation (progression) |
The correlation between the portfolio and the benchmark. |
|
Correlation (returns) |
The correlation of returns. The correlation indicates the degree of linear relationship between two variables (e.g. the returns of two securities). It assumes values between -1 and +1. When comparing the returns of two securities, a value of +1 means If the return on the first security is high (low) in a period, the return on the second security is also high (low) in this period. The designations "high" and "low" refer to the respective security. For example, a constant value can be added to all returns on a security without changing the correlation of the returns. A value of -1 means a reversal of "high" and "low", i.e: If the return on the first security is high (low) in a period, the return on the second security is low (high) in this period. A value of 0 means that no correlation could be established in this way; however, a different type of correlation may exist. As a rule, a low correlation between different forms of investment is desired, as risk diversification is assumed in this case.
The correlation of returns is therefore of interest, as one starts with returns of 0 at the time of investment and the investment should generally be as diversified as possible over the next period. |
|
Jensen-Alpha |
The Jensen alpha can be used as a benchmark for the performance of the management (of a fund) in relation to the risk-adjusted benchmark return. A positive Jensen alpha implies an outperformance. The level of the Jensen alpha symbolizes the additional return that could be achieved through the active management of the fund manager. |
|
Jensen beta |
The Jensen beta can be interpreted as a measure of risk and measures the dependence of the risk-adjusted portfolio return on the risk-adjusted benchmark return.
|
|
Sharpe ratio |
The Sharpe ratio is the quotient of the annualized additional return compared to a risk-free investment and volatility. The corresponding formula can be found in the section Portfolio theory and risk. |
|
Treynor ratio |
The Treynor ratio is comparable to the Sharpe ratio, although the beta rather than the volatility is selected as the risk measure. The corresponding formula can be found in the section Portfolio theory and risk. |
|
Calmar ratio |
With the Calmar ratio, the annualized excess return is not divided by the volatility, as with the Sharpe ratio, but by the maximum drawdown. |
|
Maximum drawdown |
Maximum loss that was accepted. |
|
Tracking error |
The tracking error is defined as the annualized standard deviation over n sample periods of the difference time series of portfolio performance and underlying security performance. The corresponding formula can be found in the section Basic key figures as time series. |
|
Information Ratio |
The information ratio is the quotient of Jensen alpha and tracking error. The corresponding formula can be found in the section Portfolio theory and risk. |
|
Modigliani measure |
The Modigliani measure is the product of the excess return over a risk-free investment and the quotient of the volatilities of the benchmark and the portfolio, i.e. it measures the excess return achieved relative to the benchmark as a percentage. The corresponding formula can be found in the section Portfolio theory and risk. |
|
Positive return elasticity |
Positive return elasticity is the dependence of portfolio performance in a rising market phase on the performance of the underlying securities. Details on the elasticities and the associated formulas can be found in the section Basic key figures as time series. |
|
Negative return elasticity |
Negative return elasticity is the dependence of portfolio performance in a falling market phase on the performance of the underlying security. |
|
Performance p. a. |
The annualized performance of the holder. |
|
Outperformance |
The (annualized) outperformance is defined as the (percentage) increase or decrease in return over a period of n periods. The corresponding formulas can be found in the section Basic key figures as time series. |
|
Probability of outperformance |
The probability of outperformance is defined as the quotient of the number of periods with positive outperformance and the number of observation periods n in a period of n periods. The corresponding formula can be found in the section Basic key figures as time series. |
|
Stability of outperformance |
The stability of outperformance is defined as the annualized standard deviation over n sample periods of the outperformance time series in a period of n periods.
|
|
Maximum profit |
The maximum profit (in the sense of a positive return) in the evaluation period indicates the greatest possible increase in value in this period. |
|
Maximum loss |
The maximum loss (in the sense of a negative return) in the evaluation period indicates the greatest possible reduction in value in this period. |
|
Maximum continuous profit |
The maximum continuous profit (in the sense of a positive return) in the evaluation period is the greatest possible increase in value achieved without interim loss in this period. |
|
Maximum continuous loss |
The maximum continuous loss (in the sense of a negative return) in the evaluation period is the largest reduction in value achieved in this period without any interim profit. |
|
Longest winning period |
The longest profit period is the maximum length of a phase of continuous profits (in the sense of a positive return) in the evaluation period. It is directly dependent on consolidation. |
|
Longest loss period |
The longest loss period is the maximum length of a phase of continuous losses (in the sense of a negative return) in the evaluation period. It is directly dependent on consolidation. |
|
Probability of a winning period |
The probability of a profit period indicates the probability with which a profit (in the sense of a positive return) could be achieved in the evaluation period. |
|
Probability of a loss period |
The probability of a loss period indicates the probability of a loss (in the sense of a negative return) being achieved in the evaluation period. |