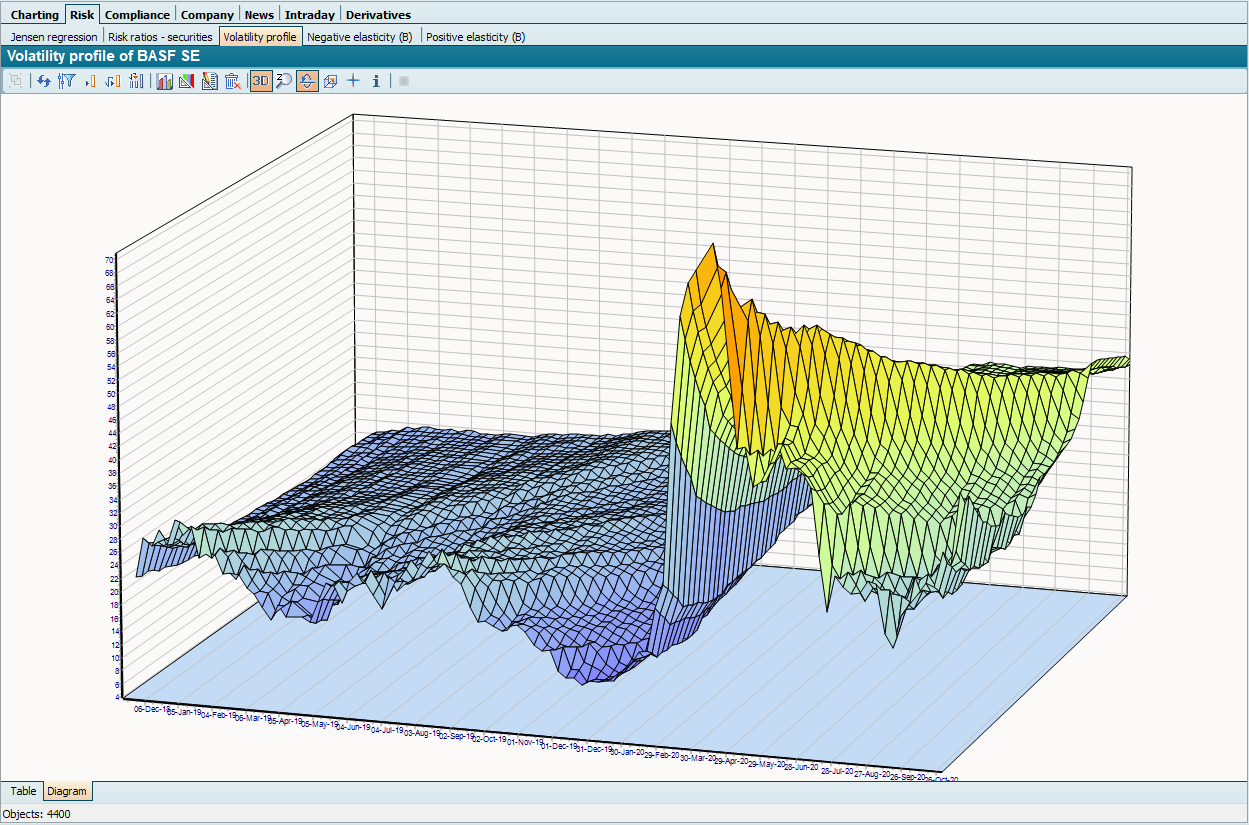
The volatility profile presents the volatility of a security (e.g. a share or warrant) over time in a visually appealing 3D chart. You can find the exact values in the corresponding table.
You can find the evaluation in the securities workspace on the "Risk" worksheet. Only individual securities make sense as input objects for this evaluation, so open a workspace for an individual security to be analyzed first if necessary.
If necessary, edit the diagram according to your requirements and save it as a new template. For information on working with diagrams, please refer to the chapter Diagrams.
Use the familiar tabs at the bottom of the evaluation window to switch between table and graph view.