Type
Trend follower
Short introduction
The Price and Volume Trend indicator (PVT) is a turnover indicator or turnover index that adds or subtracts a percentage of the daily change depending on price gains or losses. The PVT is therefore similar to On Balance Volume, but its calculation is based on the total daily volume.
Statement
In contrast to the OBV, the PVT differentiates between significant and only minor price fluctuations. This naturally makes it more objective than the OBV.
Formula/calculation
PVT = ((C -Cn-1) ÷Cn-1 * V) +PVTn-1
Interpretation
If the market rises without the PVT following this movement, prices are at a top. This could result in falling share prices. If the PVT stagnates while the market is falling, this indicates a lower reversal point, i.e. rising prices in the near future.
The PVT indicates whether capital is flowing into the equity market or whether it is being withdrawn from the equity market. The interpretation can be further refined by displaying the moving average. If the indicator falls below its average line, this is referred to as a sell signal and vice versa as a buy signal.
Default setting
-
Daily calculation
Basic trading systems
-
Price and Volume Trend (PVT)
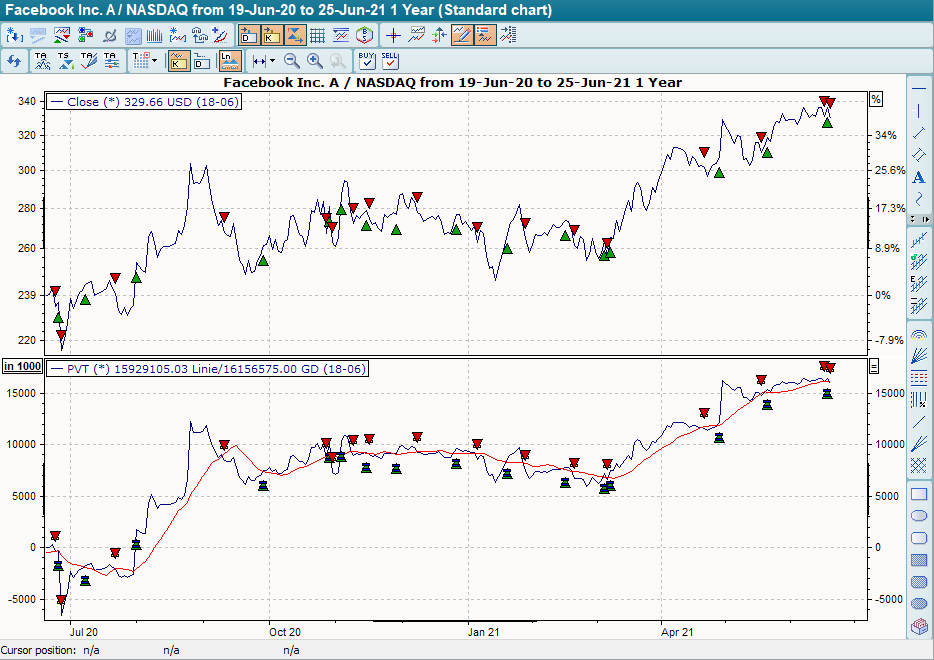
In the basic trading system "Price and Volume Trend (PVT)", the linear GD 15 is plotted alongside the indicator. It provides buy signals when the indicator breaks through its GD 15 from bottom to top, and sell signals when it breaks through its GD 15 to the bottom.