Type
Trend follower
Short introduction
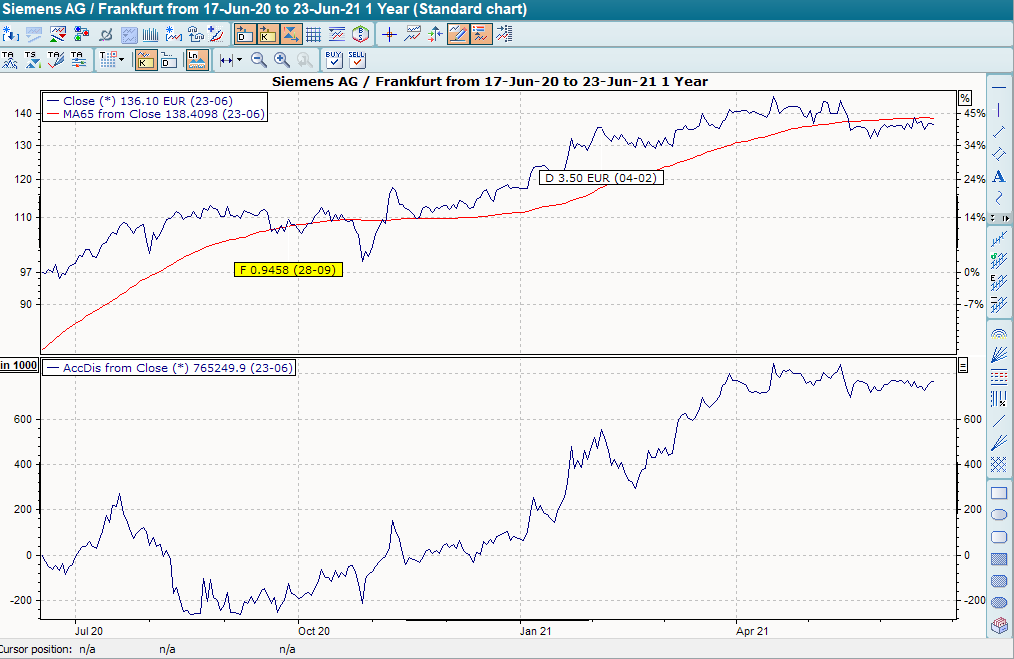
Marc Chaikin developed the Accumulation/Distribution Line on the basis of the on-balance volume indicator. In order to "relativize" the price changes, the prices are weighted with the turnover.
Statement
The principle of the indicator is that on days that close above the daily average price, this value is added to the previous day's value of the indicator, weighted by a corresponding portion of the turnover. On days that close below the daily average price, the procedure is exactly the opposite. The new value can be positive or negative, so it is always added to the previous day's value.
Formula/calculation
Accumulation/Distribution Line = [((C-L) - (H-C)) / (H-L) * V] + I
where:
I = A/D value previous day
Interpretation
Through its calculation, the indicator shows how the money is flowing. It is particularly important that only an appropriate portion of the turnover (but not the entire turnover) is included in the calculation. The further the price deviates from the mean value, the more turnover is generated.
Two possible interpretations are frequently used:
-
Search for divergences: A negative signal is given when the underlying asset is still forming new highs while the indicator is no longer forming new highs. A positive signal is given when the actual price trend still forms new lows, but the indicator no longer does.
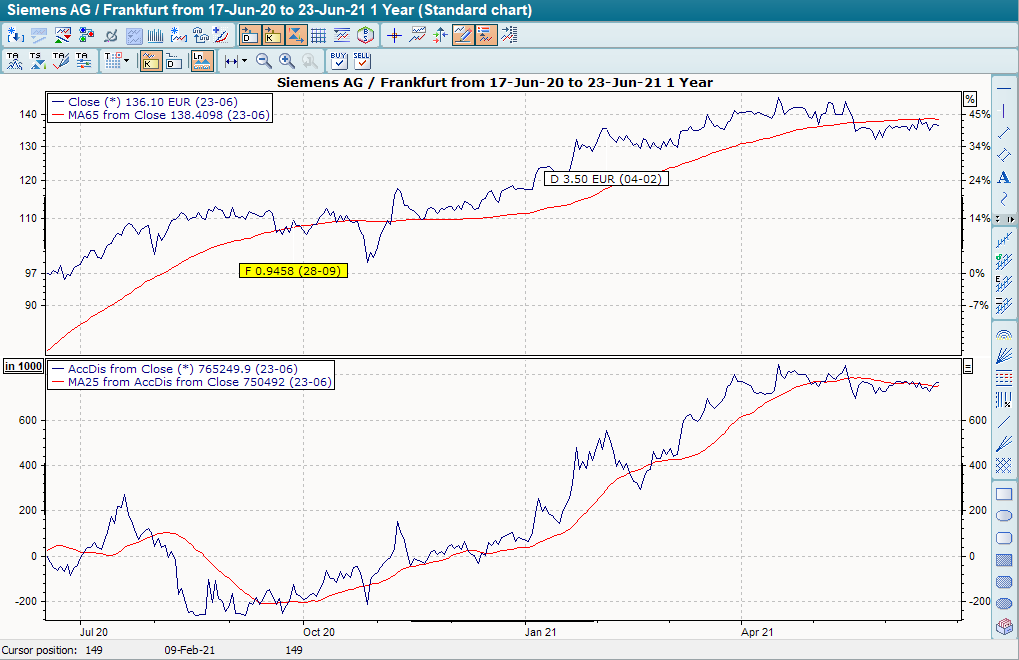
-
Another option is to calculate a moving average (GD) on the indicator and use the intersection of the two lines as a signal generator. A buy signal is given when the indicator crosses its GD from bottom to top, a sell signal is given when the indicator crosses its GD from top to bottom.
It is recommended never to use the indicator alone, but only in conjunction with other indicators.
Default setting
-
daily
Basic trading systems
-
Accumulation/Distribution Line
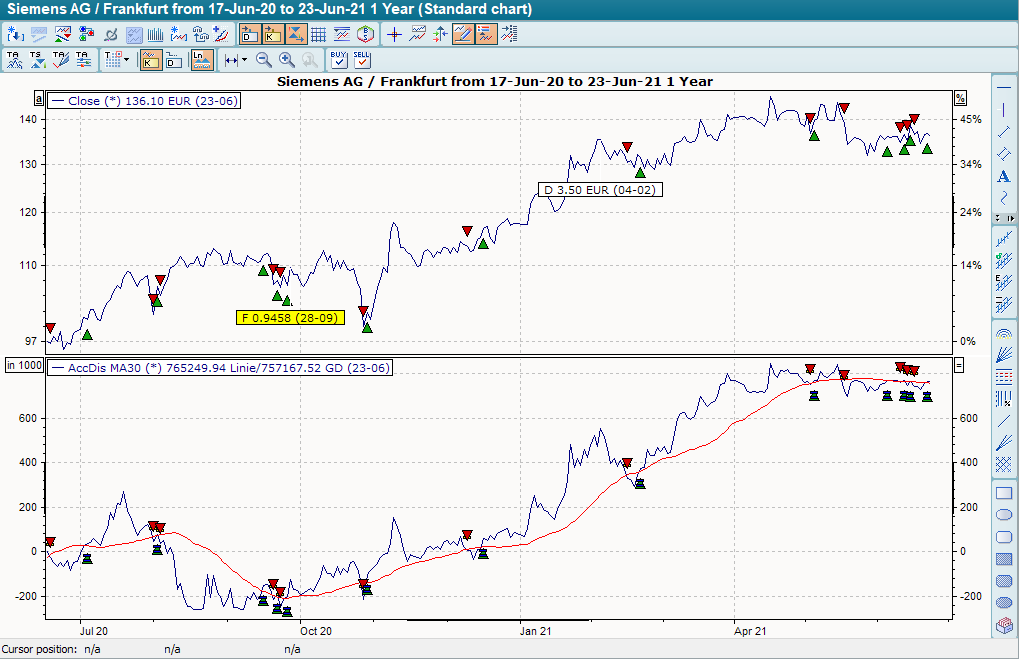
In its default setting, the basic trading system "Accumulation/Distribution Line" provides buy signals when the ACCDIS crosses its linear GD 30 from bottom to top, and sell signals when it crosses the GD from top to bottom.