Type
Oscillator
Short introduction
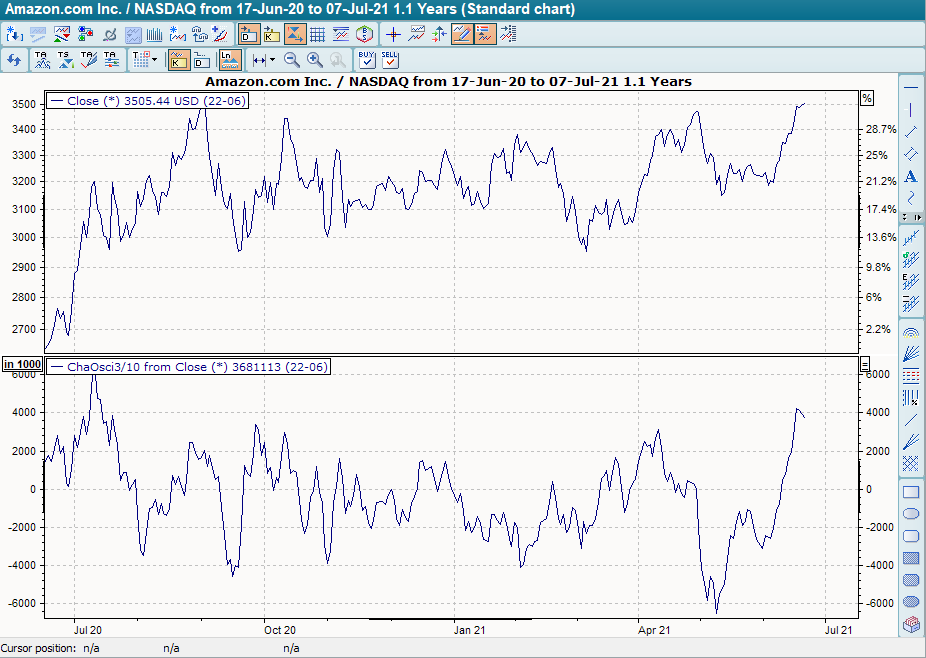
Marc Chaikin developed the Chaikin Oscillator on the basis of his Accumulation/Distribution Line.
Statement
The idea of the oscillator and thus the further development is to indicate trend changes in the underlying accumulation/distribution line, i.e. to perform a typical oscillator task. Two exponential GDs are calculated on the accumulation/distribution line, one short and one long. The long GD is then subtracted from the short GD. The result is an open upward and downward curve that fluctuates around the zero line.
Formula/calculation
Unknown Attachment
where:
A/D = Accumulation/Distribution Line
Interpretation
A fundamental understanding of the basic indicator, the accumulation/distribution line, is important for the application of the indicator. Please read the details there. As with other oscillators, there are two different ways of interpreting the Chaikin oscillator.
Firstly, the search for divergences: A negative signal is given when the underlying asset is still forming new highs while the indicator is no longer forming new highs. A positive signal is given when the actual price trend still forms new lows, but the indicator no longer does.
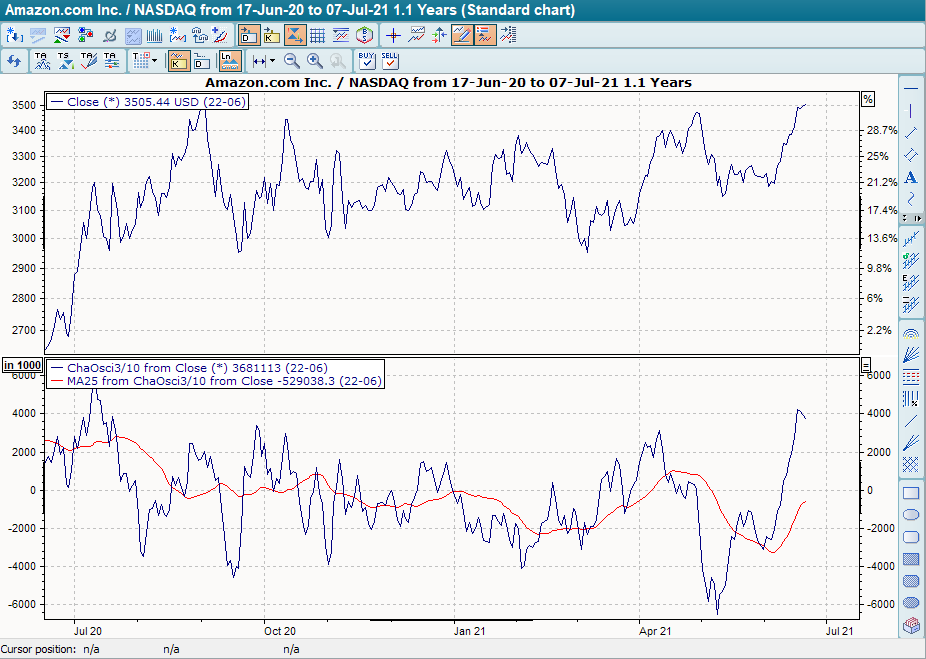
Another option is to calculate a GD on the indicator and use the intersection of the two lines as a signal generator. A buy signal is given when the indicator crosses its GD from bottom to top, a sell signal is given when the indicator crosses its GD from top to bottom.
Default setting
-
3 days for the short GD
-
10 days for the long GD
Basic trading systems
-
Chaikin Oscillator
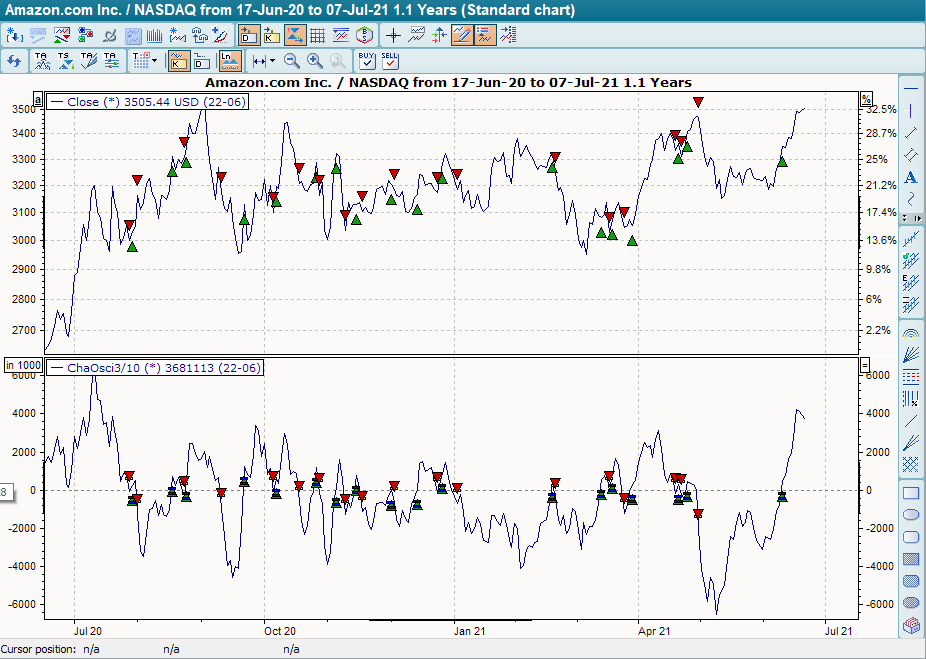
With the default settings described above for the two exponential GDs, the BHS provides buy signals when the indicator crosses the zero line from bottom to top and sell signals when it crosses the zero line from top to bottom.