Type
Trend follower
Short introduction
The On Balance Volume indicator, abbreviated to OBV, compares volume (turnover) and price changes.
Statement
The OBV indicator adds or subtracts the daily volume of the stock for a given period depending on whether the daily closing price is higher or lower than that of the previous day. The OBV is usually still smoothed.
Formula/calculation
The calculation depends on whether today's closing price is higher, lower or the same as the previous day's closing price:
ifCt >Ct-1 then OBV =OBVt-1 + V
ifCt <Ct-1 then OBV =OBVt-1 - V
ifCt =Ct-1 then OBV =OBVt-1
Interpretation
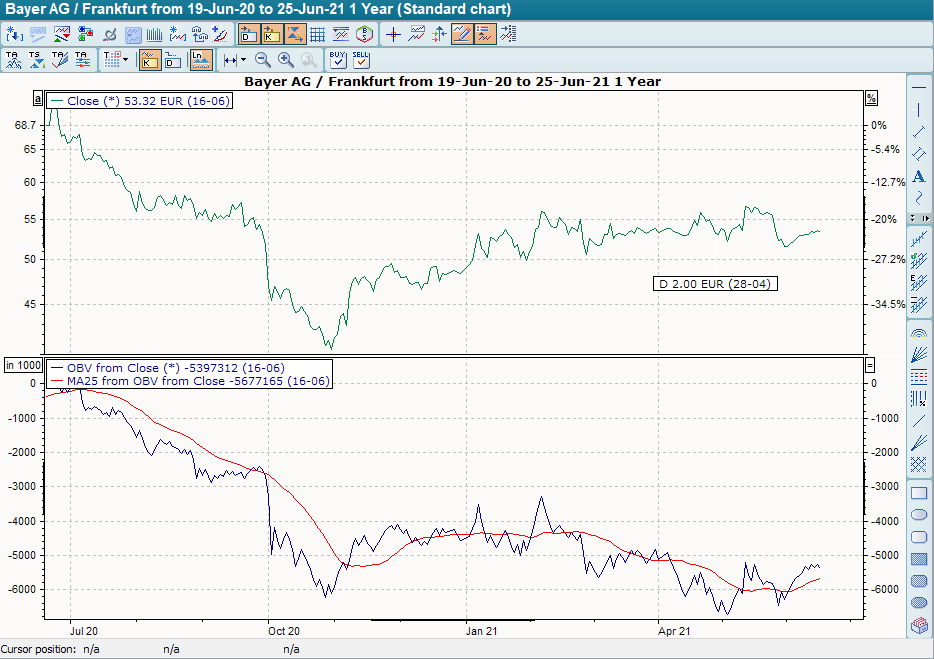
If the market rises without the OBV following this movement, prices are at a top. This could result in falling share prices. If the OBV stagnates while the market is falling, this indicates a lower reversal point, i.e. rising prices in the near future.
The OBV shows whether capital is flowing into the stock market or being withdrawn from it. The interpretation can be refined accordingly by displaying the moving average. If the indicator falls below its average line, this is a sell signal; conversely, it is a buy signal.
Default setting
-
Daily calculation
Basic trading systems
-
On Balance Volume (OBV)
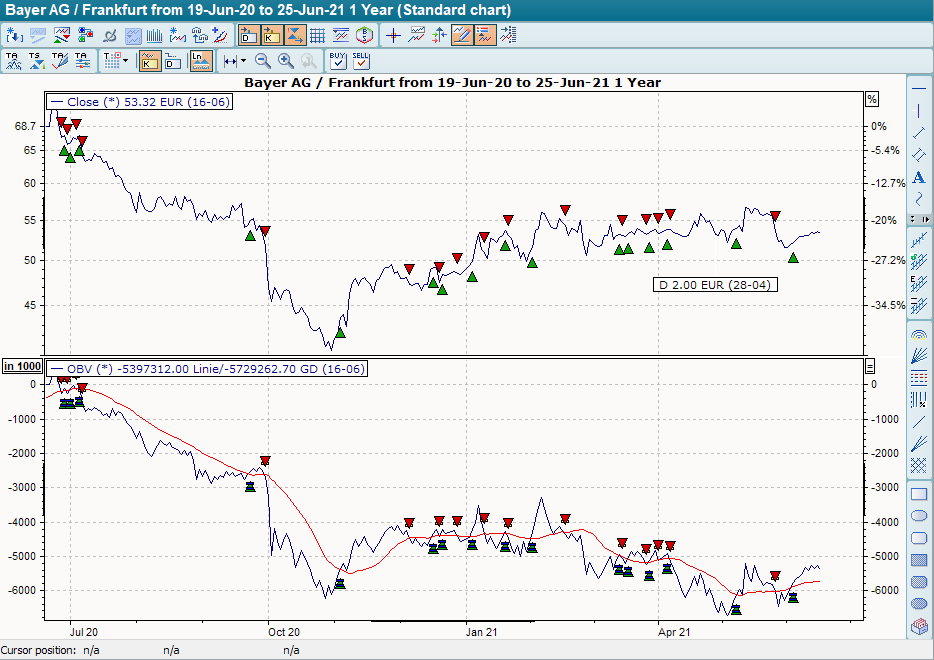
The basic trading system "On Balance Volume (OBV)" shows the indicator and its (linear) GD 20 (red time series). The base trading system provides buy signals when the indicator breaks through its GD 20 from bottom to top and sell signals when it breaks through its GD 20 to the bottom.