Type
Oscillator
Short introduction
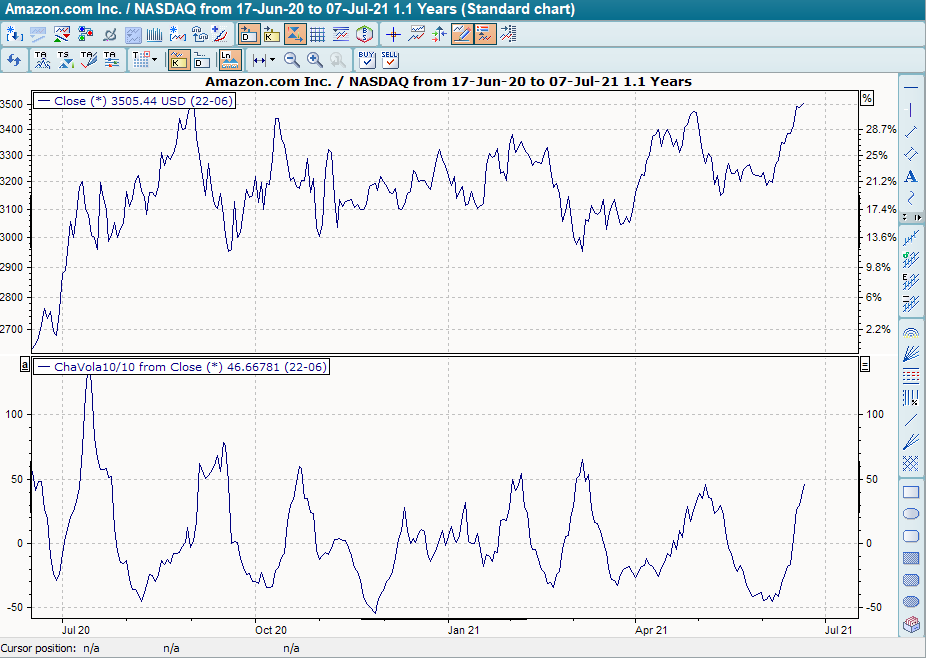
Marc Chaikin developed this indicator. Volatility is measured by the difference between the daily low and the daily high.
Statement
Chaikin's Volatility fluctuates around the zero line, a positive indicator value shows increasing volatility (i.e. increasing differences between high and low). A negative indicator value shows decreasing volatility, i.e. a decreasing difference between high and low.
For the calculation, the difference between the daily high and the daily low is formed first. A GD is calculated on this and a ROC on this.
Formula/calculation
Unknown Attachment
Interpretation
Chaikin's Volatility is generally not used to derive specific signals, but rather to "round off" a trading system.
Default setting
-
10 days each for ROC and GD
Basic trading systems
-
Chaikin Volatility
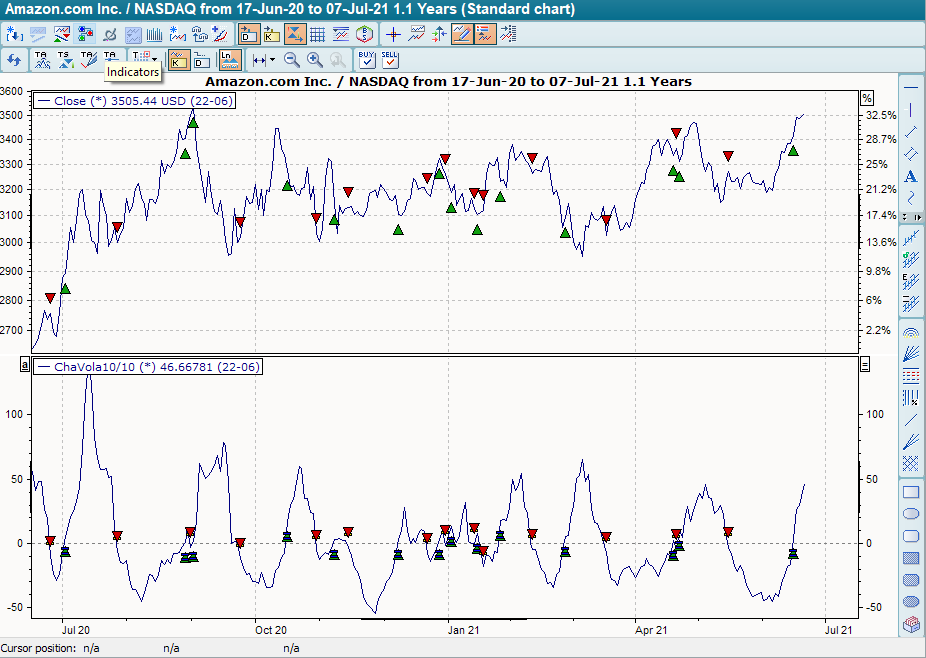
With the default settings for GD and ROC described above, the indicator provides buy signals when it breaks through the zero line from bottom to top and sell signals when it breaks through the zero line from top to bottom.