Type
Trend follower
Short introduction
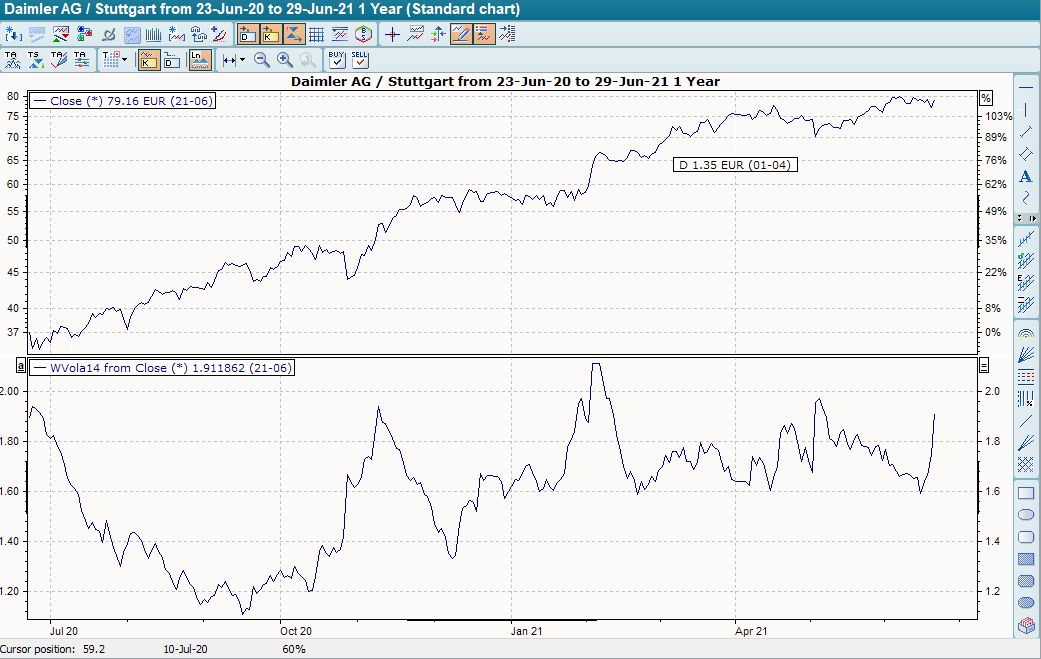
Welles Wilder uses this indicator to calculate a kind of volatility based on the true range of a day.
Statement
The true range is used in some indicators, such as the DMI, in order to correctly include days with a small daily trading range but a large gap to the previous day's close in the calculation of volatility. The true range is always positive and represents the maximum of the three following formulas:
-
Distance daily high today/daily low today
-
Distance daily high today/closing price yesterday
-
Gap daily low today/closing price yesterday
A GD is formed on this true range, whereby Wilder has recommended a simple 14-day GD. The result is the "Average True Range" (ATR). The sequence of ATRs results in Wilder's Volatility. Since the True Range is always positive, Wilder's Volatility is also always positive.
Formula/calculation
-
Measuring the True Range TR
-
ATR = MAx (TR)
-
Wilder's Volatility =ATRt + I
where:
I = Wilder's Volatility previous day
Interpretation
Wilder's Volatility does not provide any independent signals. A rising indicator trend merely signals increasing volatility, while a falling trend indicates decreasing volatility.
Default setting
-
The GD is calculated over 14 days as standard.
Basic trading systems
-
None