Type
Trend follower/trend intensity indicator
Short introduction
The Directional Movement Indicator (DMI) developed by Welles Wilder can be displayed in a wide variety of forms and thus provides a wide range of analysis options. The common abbreviation is DMI. The DMI concept also includes the +DI, the -DI, the ADX and the ADXR.
Statement
The starting point for Wilder's considerations is that in an uptrend the current high is higher than the high of the previous day and in a downtrend the current low is lower than the low of the previous day. Based on this consideration, the +DI is calculated as an indicator for the upward movement and the -DI as an indicator for the downward movement.
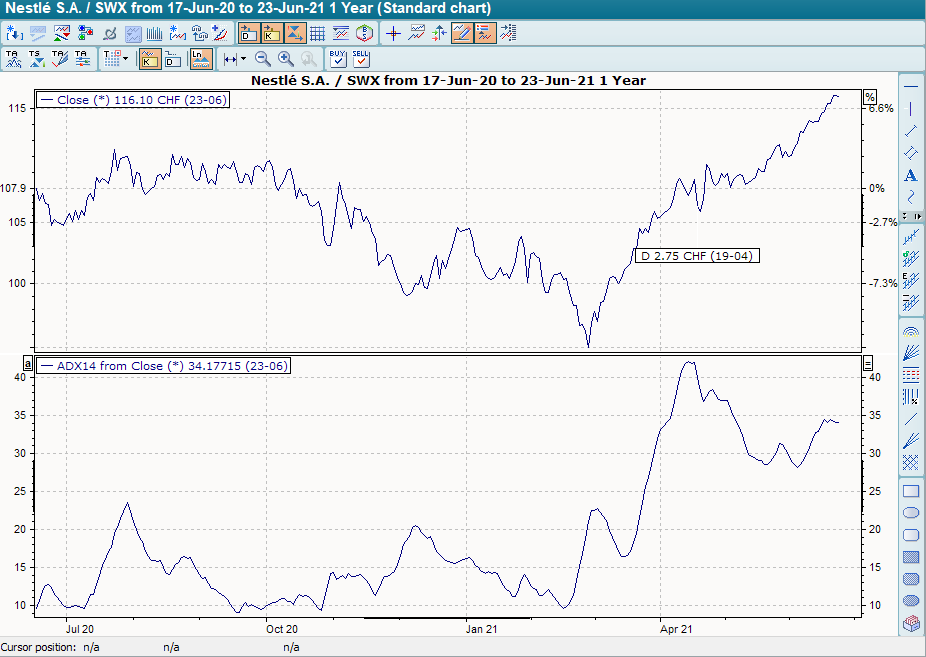
The actual DMI sets these two indicators in relation to each other in order to quantify the direction of movement. Smoothing the DMI produces the ADX, which measures the trend intensity. Further smoothing of the ADX then results in the ADXR.
Formula/calculation
-
Calculation of +DM and -DM
-
Measuring the True Range (TR)
-
Calculation of the directional indicator (+DI and -DI) by dividing the DM by the TR:
Unknown Attachment
Smoothing is appropriate. Wilder has suggested a period of 14 days for this:
Unknown Attachment
The DMI is rarely shown due to its high volatility. Calculation:
Unknown Attachment
Smoothing the DMI results in the ADX. Wilder recommended the same smoothing factor as for the calculation of +DI and -DI.
Further smoothing results in the ADXR. As a rule, you add today's ADX to the ADX 14 days ago and then divide the sum by a factor of two. The result corresponds to the current ADXR.
Interpretation
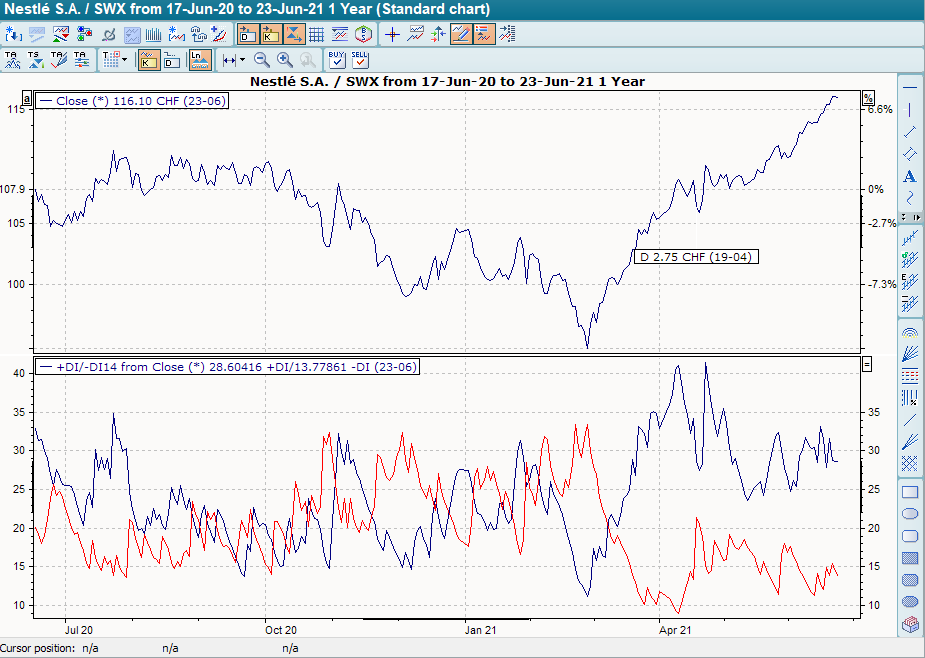
The +DI and -DI form the basis for the DMI. Both measure the strength of their movement, the +DI the upward strength, the -DI the downward strength. If the +DI is higher than the -DI, there is an upward trend; in the opposite case, there is a downward trend. The further apart the two lines are, the stronger the respective trend. The DMI summarizes the two lines; the higher its value, the stronger the trend. The DMI does not say whether this is an upward or downward trend.
As the DMI is very mobile, it is generally smoothed and displayed as an ADX, which makes interpretation easier and more reliable.
With rising ADX, i.e. an increasing trend strength, the crossing points between +DI and -DI can also be used as a signal. If the +DI crosses the -DI from bottom to top, this is a buy signal; if the +DI crosses the -DI from top to bottom, this is a sell signal. If the ADX is falling, such signals are ignored.
Default setting
-
14 days for all parameters
Basic trading systems
-
Directional Indicator (+DI/-DI)
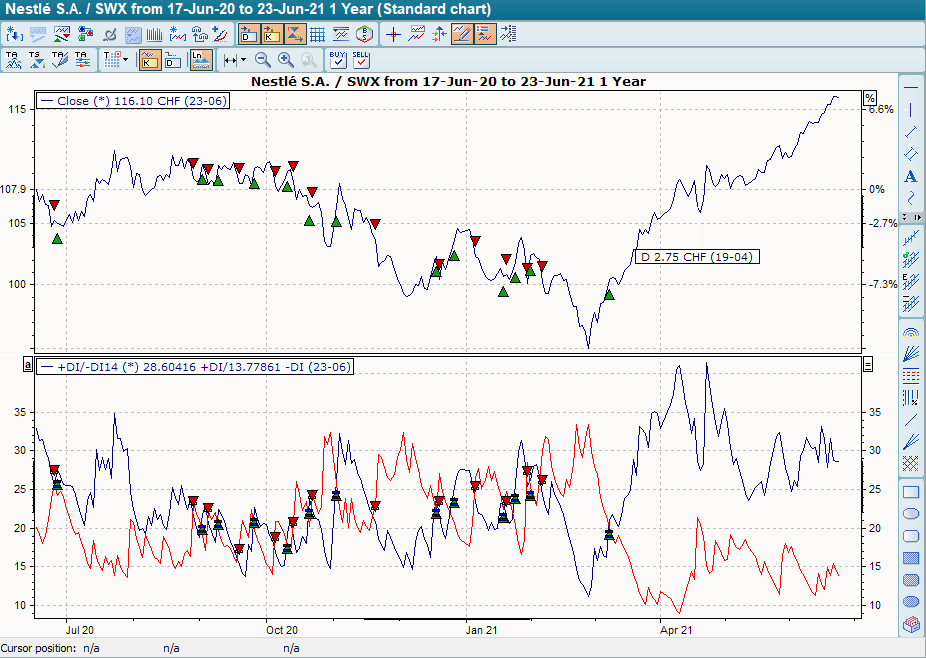
In its standard setting (14 days), the BHS "Directional Indicator (+DI/-DI)" provides buy signals when the +DI crosses the -DI from bottom to top. It provides sell signals when the +DI intersects the -DI from top to bottom.