Type
Trend intensity indicator
Short introduction
The Commodity Channel Index (CCI) was developed by Donald Lambert. He wanted to use this indicator to determine the beginning and end of commodity cycles.
Statement
The CCI calculates a value that measures the distance to the GD. From a certain distance, Lambert assumes a new trend - the indicator provides a signal.
Formula/calculation
The calculation of the indicator is complex as it involves several steps. In the first step, a so-called typical rate is formed. To do this, the highest, lowest and last price are added together and then divided by 3. A GD is then calculated on the basis of these typical prices. In the third step, the standard deviation Typical price / GD is calculated. The last step builds the actual CCI. The indicator fluctuates around the zero line, but is not limited upwards or downwards.
Unknown Attachment
Unknown Attachment
Unknown Attachment
Unknown Attachment
where:
X = significant price
MAX = Moving Average of X
sX = standard deviation of X
abs = absolute value
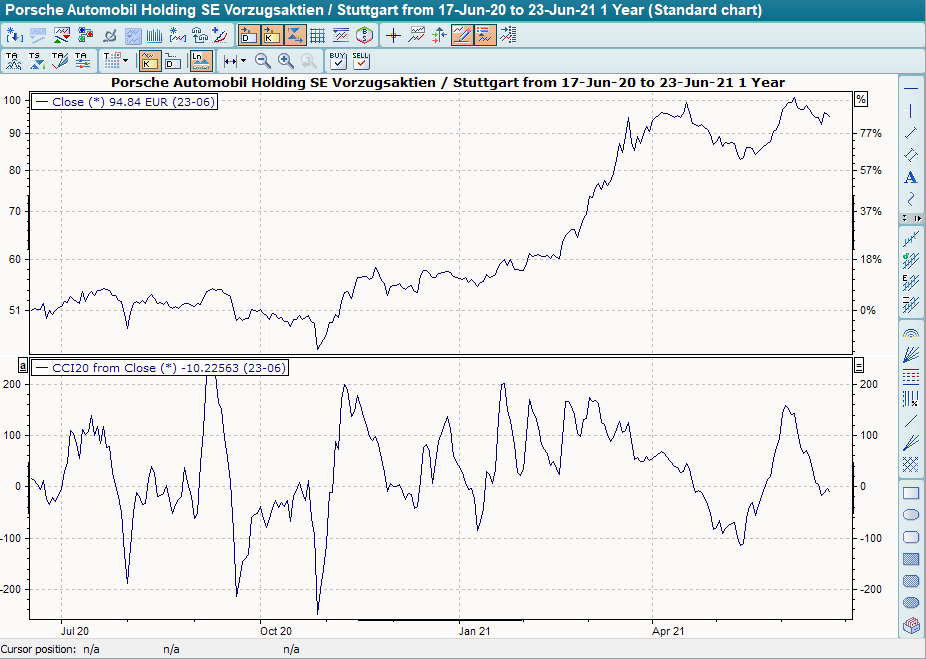
Interpretation
Unlike many other trend followers and trend intensity indicators, the zero line itself has no meaning for this indicator. As suggested by Lambert, two further lines are generally entered at 100 and -100. If the indicator moves between the two lines, Lambert speaks of a trendless market, as the distance between price and GD according to the CCI definition is too small to be able to identify a trend.
A buy signal is given when the indicator breaks through the 100 line from bottom to top. This position must be sold (closed out) if the indicator falls below the 100 line again.
The indicator gives a sell signal in the sense of a short sell when it breaks through the line at -100 from top to bottom. This position must be liquidated again by buying if the line at -100 is breached again from bottom to top.
Default setting
-
Normal application: 20 weeks
-
Extremely short: 20 days
Basic trading systems
-
Commodity Channel Index (CCI)
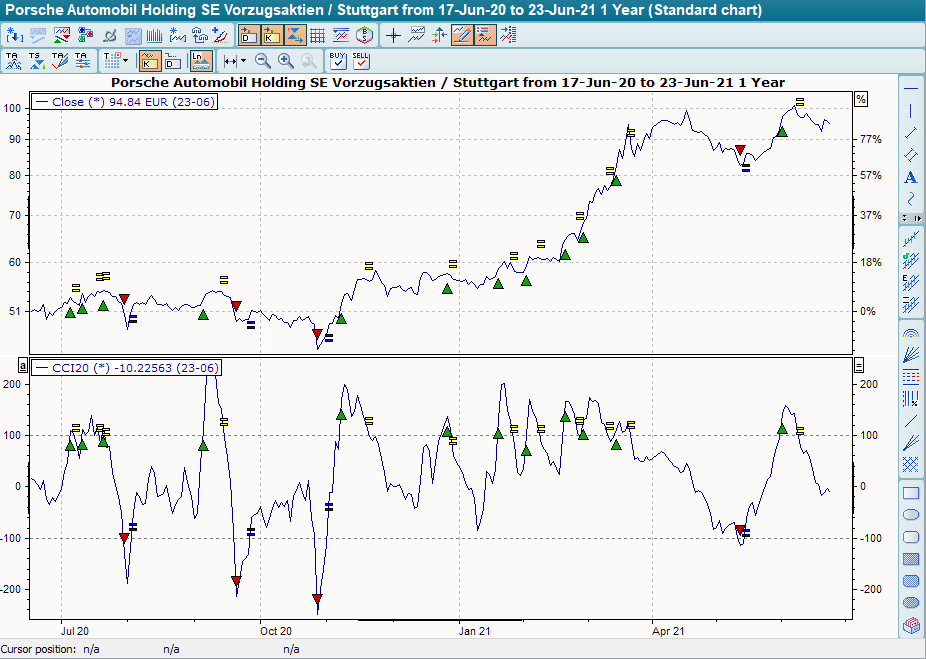
In its standard setting, the BHS provides a buy signal when the indicator breaks through the +100 line from bottom to top. This position is closed if the indicator falls below the +100 line again. The BHS gives a sell signal when the indicator breaks through the -100 line from top to bottom. This position is closed in the same way if the -100 line is cut again from bottom to top.