Type
Trend follower
Short introduction
Moving averages are among the oldest and by far the most widely used indicators. As a rule, they are abbreviated to GD or MA in the US. GDs can be calculated in very different ways and can therefore be used in a variety of ways. In addition to many independent analyses, many other indicators are also based on GDs.
GDs form the basis of most technical analyses.
Statement
The term "moving average" expresses the two most important characteristics of the indicator. "Average" means that an average value of the prices is formed over a certain number of days. "Moving" means that the calculation is shifted forward by one day with each new price, i.e. the last price up to that point is not included in the calculation.
The mean value is "trend-following" in the truest sense of the word, so the GD is of course the simplest (and probably also the most important) of all trend followers.
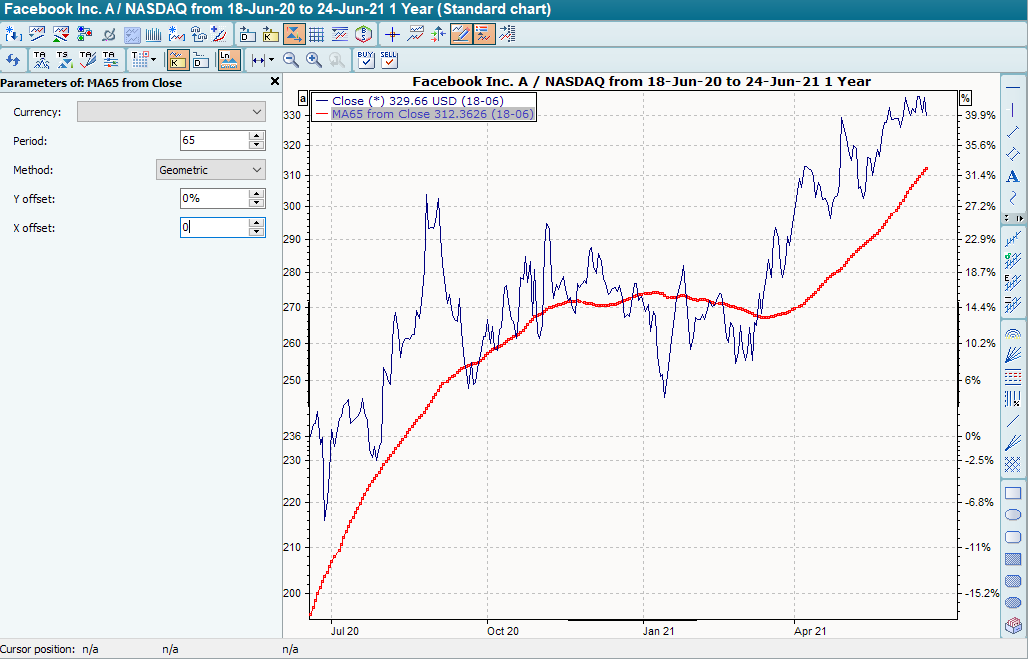
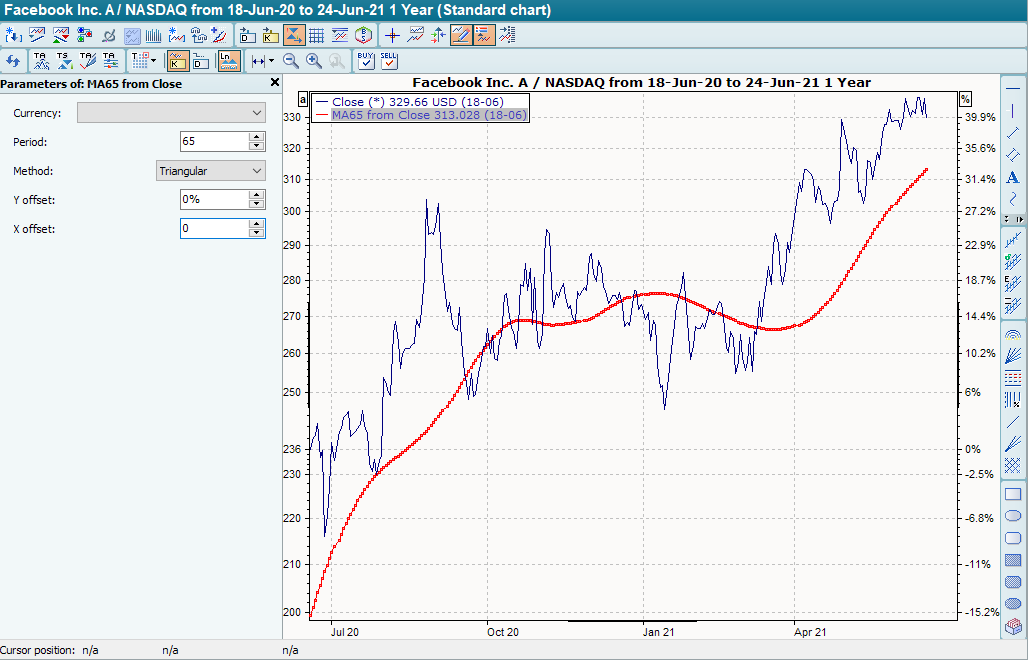
Over the years, more and more different types of calculation have been introduced for the GD, such as weighted, geometric, exponential or triangular calculation. There were also various other ideas, such as horizontal or vertical offsets.
Formula/calculation
MAt = (Ct +Ct-1 +Ct-2 + ... +Ct-n+1) ÷ n
where:
MAt = current value of the simple GD
Standard calculation of the moving average; all prices are given the same weight in the calculation.
WMAt=W1Ct+W2Ct-1+W3Ct-2+...+WnCt-n+1) ÷ (W1+W2+...+Wn)
where:
WMAt = current value of the weighted GD
Wn = respective weighting factor
EMAt =EMAt-1 + (SF * (Ct -EMAt-1))
where:
EMAt = current value of the exponential GD
SF = Scoring factor (most common scoring factor: 2 ÷ (n + 1))
where:
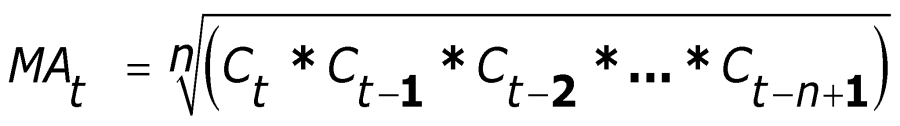
MAt = current value of the geometric GD
The calculation of the triangular GD takes into account the period - is it "even" or "odd"?
For an even number of days (e.g. 20 days), the value for the calculation period m is 10 and the value for the smoothing constant n is 11.
For an odd number of days, the calculation period and smoothing constant have the same value.
Odd period length: m = (period length/2) + 0.5; n = m
Even period length: m = (period length/2); n = m + 1
TMAt = (MAt +MAt-1 + ... +MAt-m+1) ÷ n
where:
TMAt = current value of the triangular GD
m = period length of the GD
n = smoothing constant
Linear representation
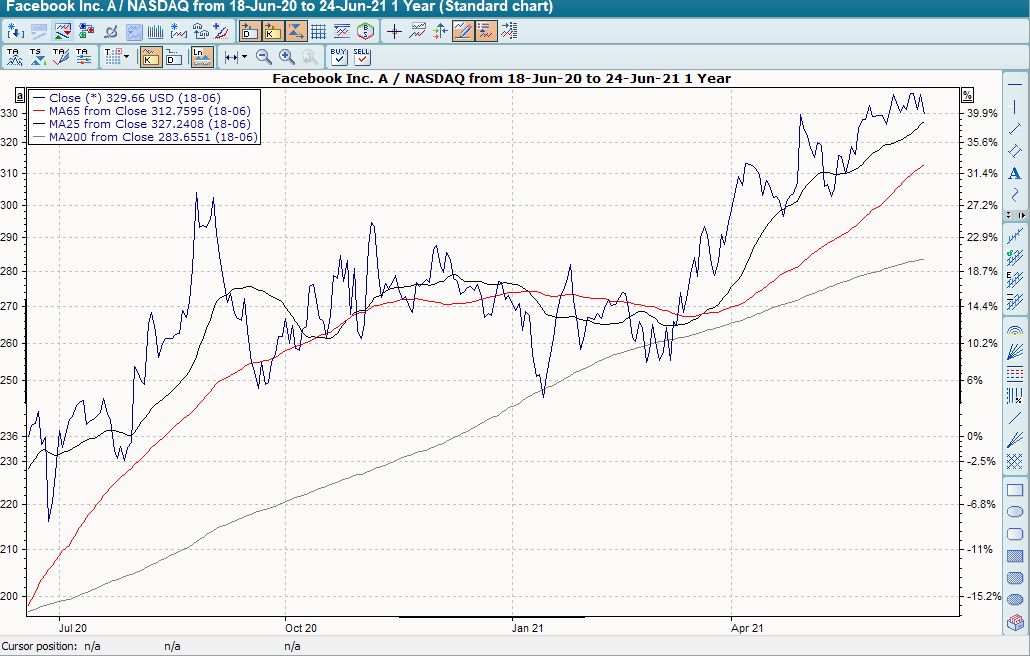
Weighted
In this calculation, all prices are again given a weighting factor. In general, the factors increase as the courses become more up-to-date. This ensures that the more recent prices are included in the formula with a higher "weighting".
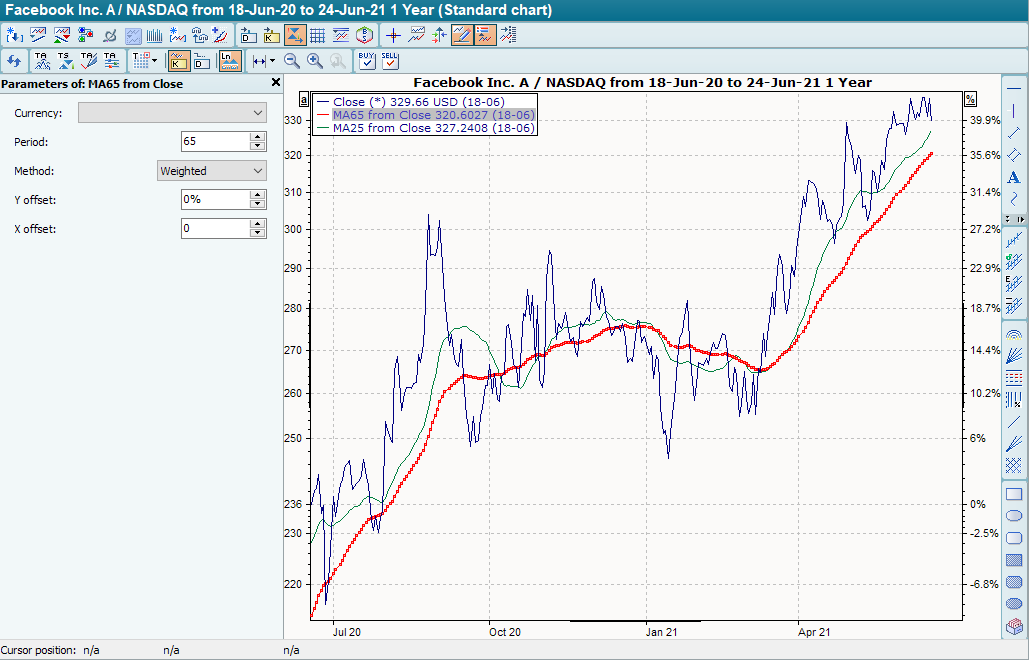
Exponential (Exponential)
Here, too, more weight is given to the more recent courses. However, the calculation is completely different from the other two methods. It is particularly important to note that with exponential GD, not one period is specified for the calculation, but all prices are used in each case. Different results may therefore be obtained for different time series lengths.
Geometric
Triangular
Interpretation
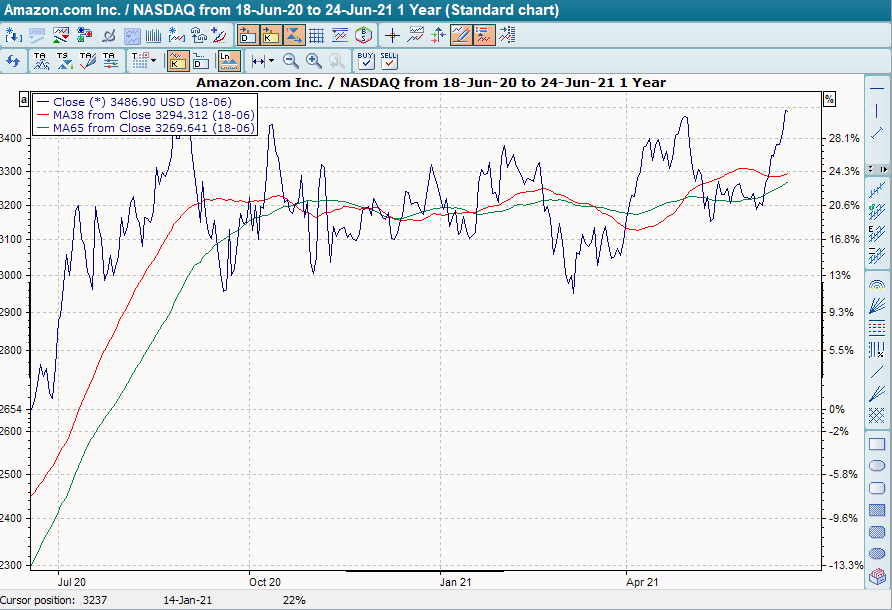
An upward pointing GD indicates an upward trend, a downward pointing GD indicates a downward trend, which results from the basic idea of smoothing. As a general rule, GDs become increasingly sluggish as the calculation period increases. Shorter calculation periods therefore provide a new signal more quickly. In stock market phases with short trends, it therefore makes sense to choose shorter periods for the calculation.
In stock market phases with strong trends, on the other hand, longer periods should be used. The disadvantage of short calculation periods is that false signals often occur, whereas with a long calculation period the signals are often only sent when a large part of the price movement up or down has already taken place.
Like the calculation of the GD, the interpretation is also very diverse. Below we present the most common interpretation.
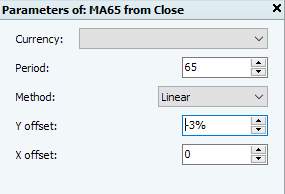
The standard interpretation is the intersection of the GD with the underlying price trend. A cut from bottom to top provides a buy signal, a cut from top to bottom a sell signal. Since this approach often leads to wrong decisions, many analysts also like to use filters. A typical filter is that a percentage (about 2% or 3%) is defined by which the GD is broken.
Default setting
We distinguish between three different areas:
-
In the short term: 5 to 49 days
-
In the medium term: 50 to 100 days
-
In the long term: More than 100 days
Basic trading systems
-
Moving average
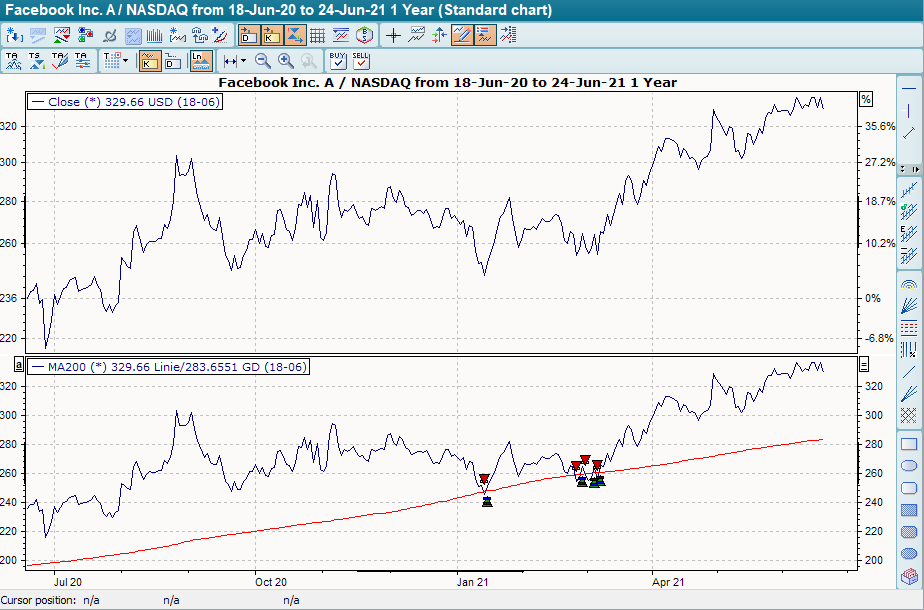
In the basic trading system "Moving average" is the standard setting for the period of the (linear) GD 200. The base trading system provides buy signals when the close breaks through its GD 200 from bottom to top, and sell signals when it breaks through the GD 200 from top to bottom.