Type
Trend follower
Short introduction
The trend confirmation indicator, abbreviated TBI, is based on two moving averages and should not necessarily be seen as an independent technical study. To set the indicator, you should also read the chapter Moving average .
Statement
The TBI attempts to confirm a trend already recognized by a GD with the help of a second GD. The two GDs, generally a short and a medium-term one, are divided for this purpose. The resulting ratio therefore fluctuates around the zero line.
Formula/calculation
TBI = (MAx /MAy) * 100
where:
MAx = Moving Average shorter period
MAy = Moving Average longer period
Interpretation
The indicator provides a buy signal when the trend crosses the 100 line from bottom to top. This means that the shorter GD has overtaken the longer one, i.e. it has cut from bottom to top. At this moment, the trend defined by the longer GD has been confirmed by the shorter GD. The same applies in reverse, i.e. when the 100 line is cut from top to bottom.
Finally, a not necessarily classic application method of the TBI: If you set the second GD to the value 1, this GD corresponds to the price trend. In this way, you can ensure that the TBI shows the distance between the first GD and the price trend. Since some analysts also pay attention to exaggerations, i.e. too "large" gaps between the GD, especially the 200-day GD and the price trend, this can be quite interesting.
The TBI should not be used as a stand-alone signal transmitter, but only to confirm existing signals. A lack of confirmation by the TBI should not be underestimated under any circumstances, especially in trend markets.
Default setting
As a rule, 2 standards are mentioned:
-
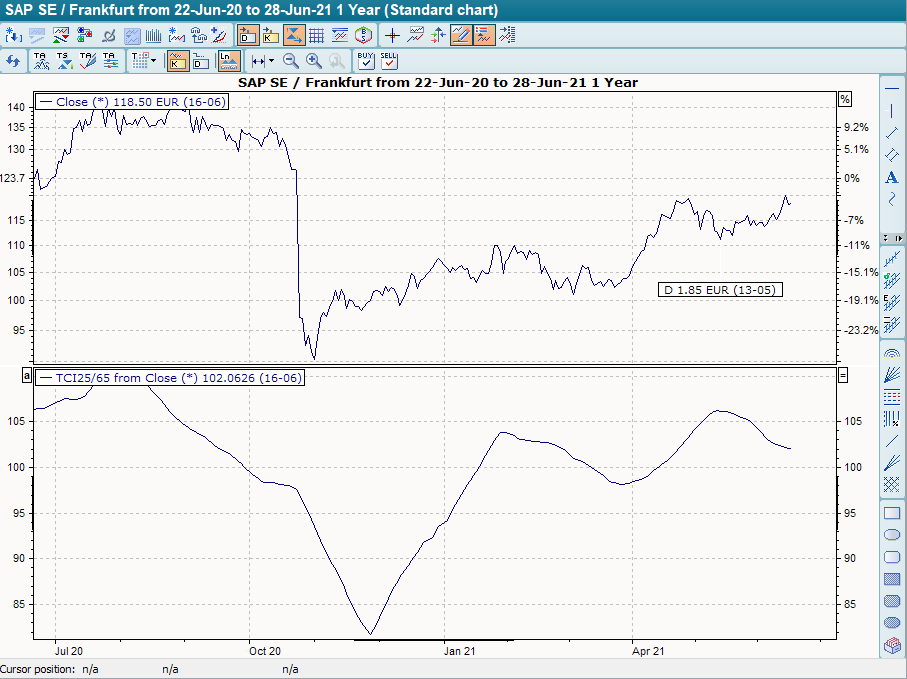
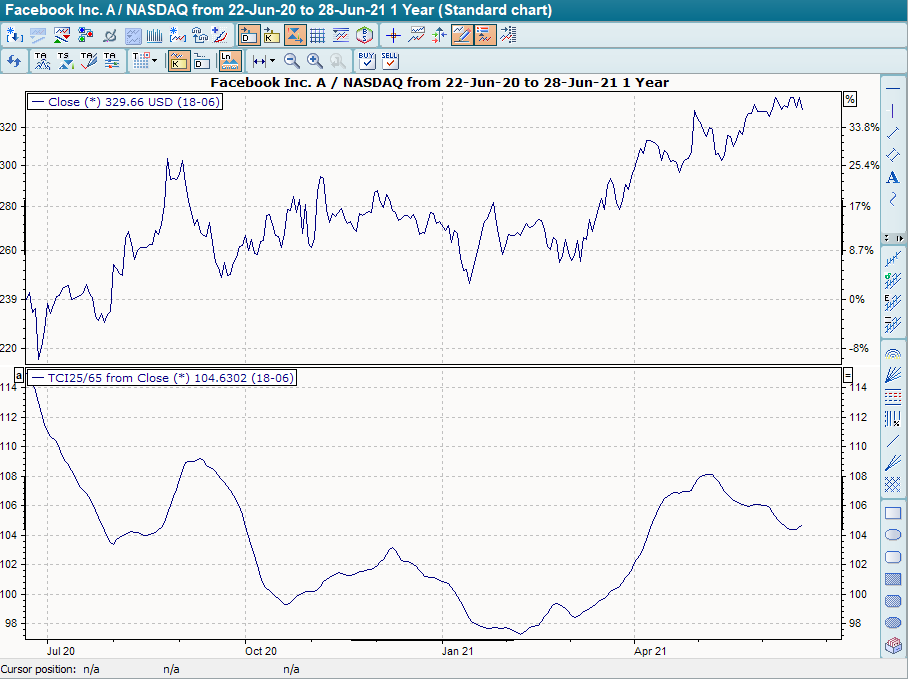
In the short term: 25 days/65 days
-
In the long term: 65 days/200 days
Basic trading systems
-
Trend Confirmation Indicator (TBI)
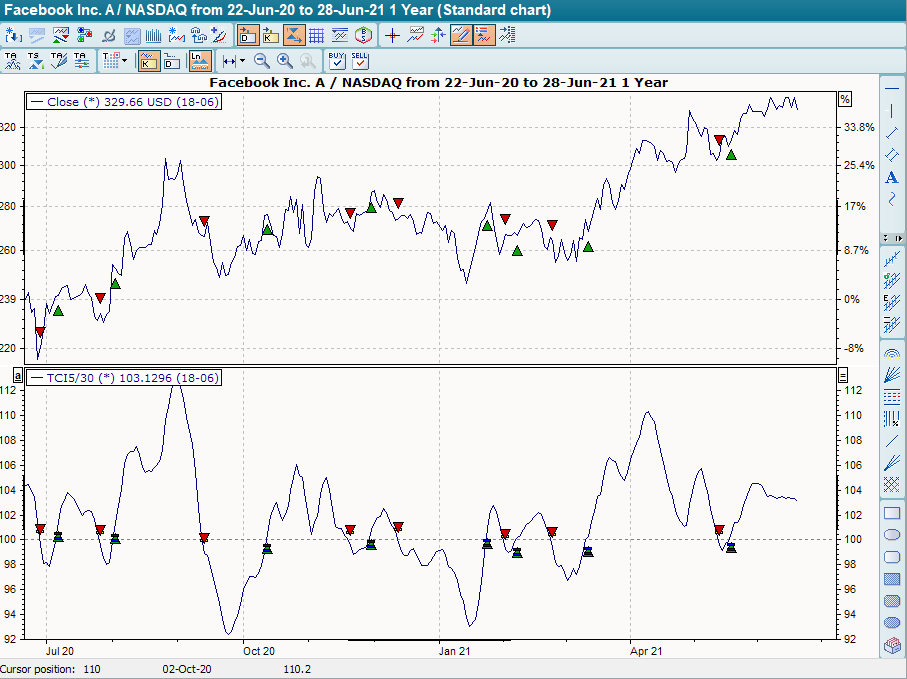
The basic trading system "Trend Confirmation Indicator (TBI)" is set to the two GD periods 5 days/30 days by default. It provides buy signals when the indicator breaks through the signal line at 100 from bottom to top, and sell signals when the indicator breaks through this line from top to bottom.