Type
Trend follower
Short introduction
The Moving Average Convergence Divergence Indicator, hereinafter referred to as MACD, has become one of the most widely used technical indicators in recent years.
What is particularly interesting about this indicator is that it can be used in almost any market situation due to its calculation and interpretation. It can therefore be described as both a trend follower and an oscillator - its basis, 3 GDs, indicate its trend-following character.
Statement
The MACD subtracts 2 GDs from each other. However, these two GDs are always calculated on an exponential basis. The curve therefore oscillates around the zero line. A value above the zero line indicates that the short GD is above the long GD, a value below the zero line expresses the exact opposite.
The convergence/divergence analysis contained in the name is applied by evaluating the distance between the zero line and the MACD curve. The further the line is from the zero line, the greater the divergence. A growing divergence indicates an intensification of the prevailing trend, while a decrease indicates a weakening of the trend. The decisive factor is therefore the trend reversal in the MACD line. To get a handle on this, Gerald Appel, the inventor of the MACD, introduced a second line, a GD of the MACD line. The signals are therefore generated when this line crosses the actual MACD line.
Formula/calculation
MACDt =EMA1t -EMA2t
where:
EMA1t =EMAx (Ct) =EMAt-1 + ((2 ÷ (x + 1)) × (Ct -EMAt-1))
EMA2t =EMAy (Ct) =EMAt-1 + ((2 ÷ (y + 1)) × (Ct -EMAt-1))
Triggers =EMAz (MACDt) =EMAt-1 + ((2 ÷ (z + 1)) × (MACDt -EMAt-1))
Interpretation
An intersection of the MACD line with the trigger from bottom to top generates a buy signal, an intersection from top to bottom generates a sell signal. The stronger or more successful the signal, the greater the divergence or the further away the MACD trend is from the zero line.
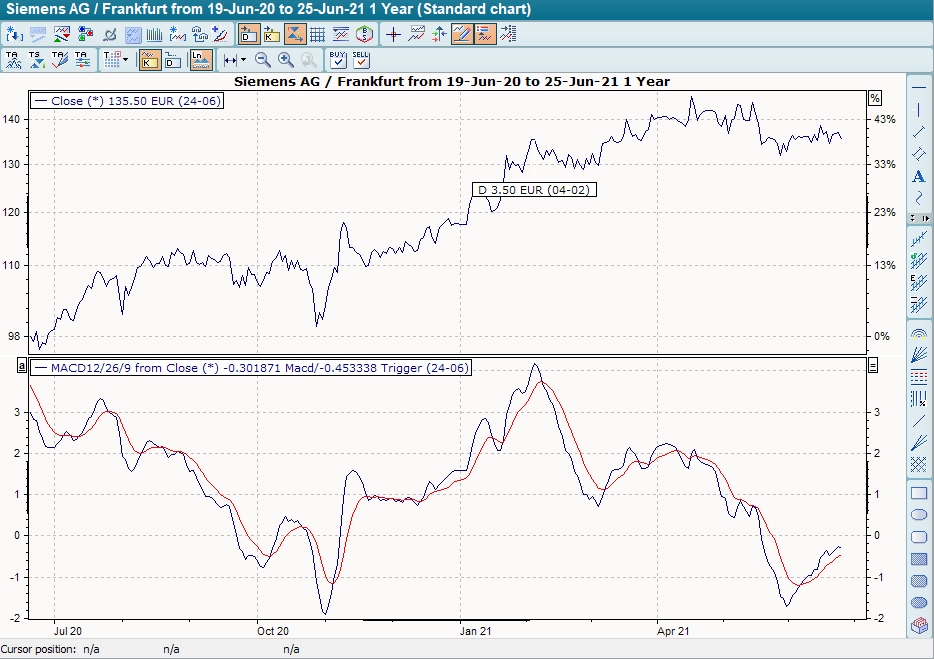
In addition to this standard use, you can also use the MACD as a simple trend indicator. If the MACD rises, the value is in an upward trend; if it falls, the value is in a downward trend.
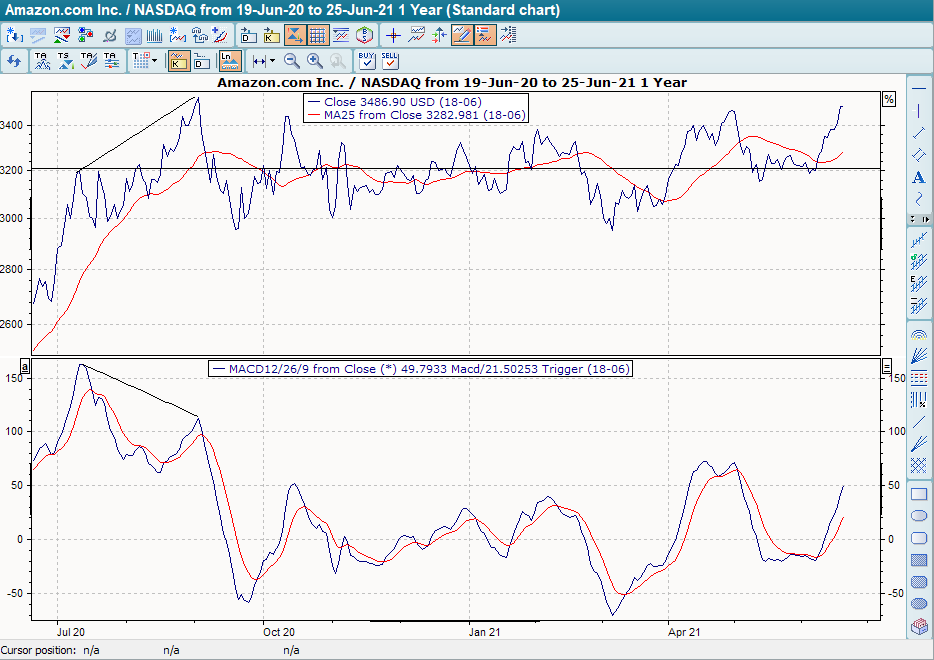
A somewhat more difficult application is the use of the MACD to investigate divergences with the underlying. This is more difficult because in this case you have to draw trend lines yourself in order to arrive at a result. An example would be the formation of new highs in the underlying, while the highs in the MACD are already declining. In this case, a trend reversal, i.e. a fall in the underlying, can be expected soon.
Default setting
-
Actual MACD: 12 and 26 days
-
Trigger line: 9 days
However, this should not stop you from experimenting with other settings. The charts in vwd portfolio manager are particularly useful for finding other interesting combinations.
Basic trading systems
-
MACD
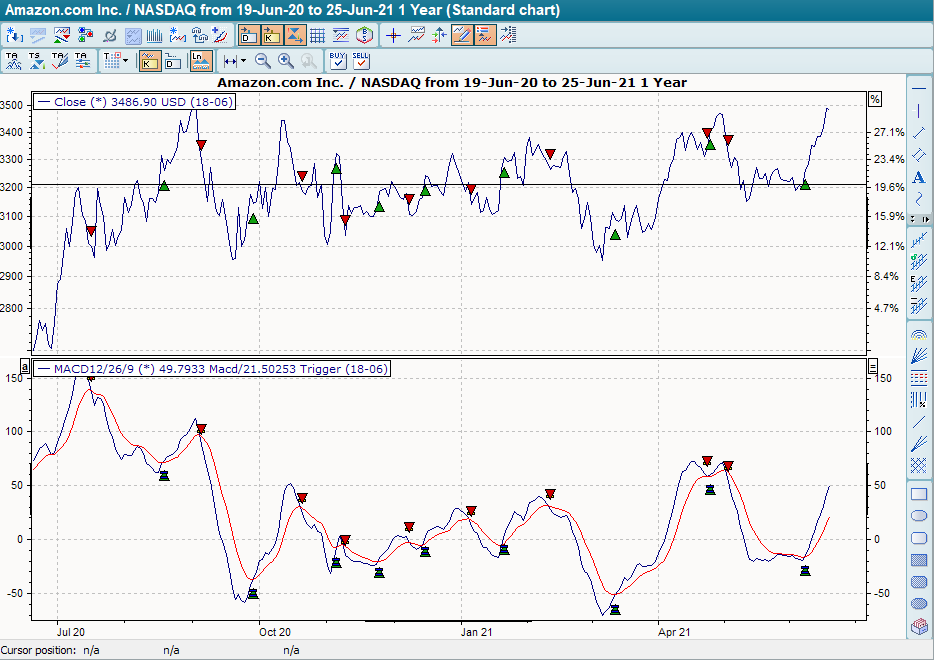
In the basic trading system "MACD", the (exponential) trigger line (red curve) is displayed next to the indicator. The default setting is 12 for the short (exponential) GD, 26 for the long (exponential) GD and 9 for the trigger period. The base trading system provides buy signals when the indicator breaks through its trigger from bottom to top and sell signals when it breaks through its trigger to the bottom.
-
MACD-DEMA
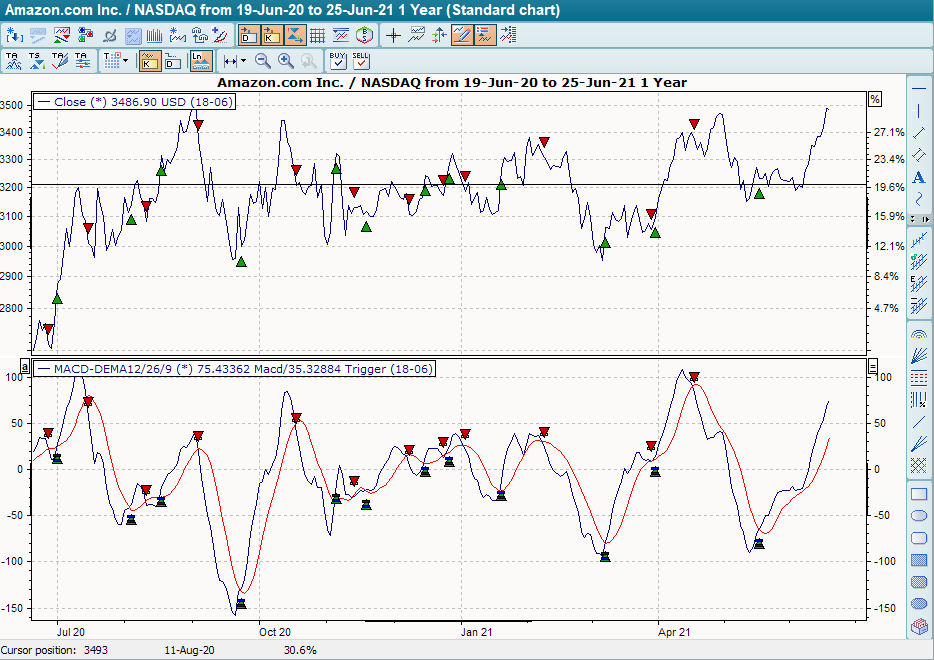
In the basic trading system "MACD-DEMA", the principle of the linear combination of its exponential averages from DEMA was applied to the MACD in its standard setting (12/26/9). Here too, the base trading system provides buy signals when the indicator breaks through its trigger from bottom to top, and sell signals when it breaks through its trigger to the bottom.
-
MACD-TEMA
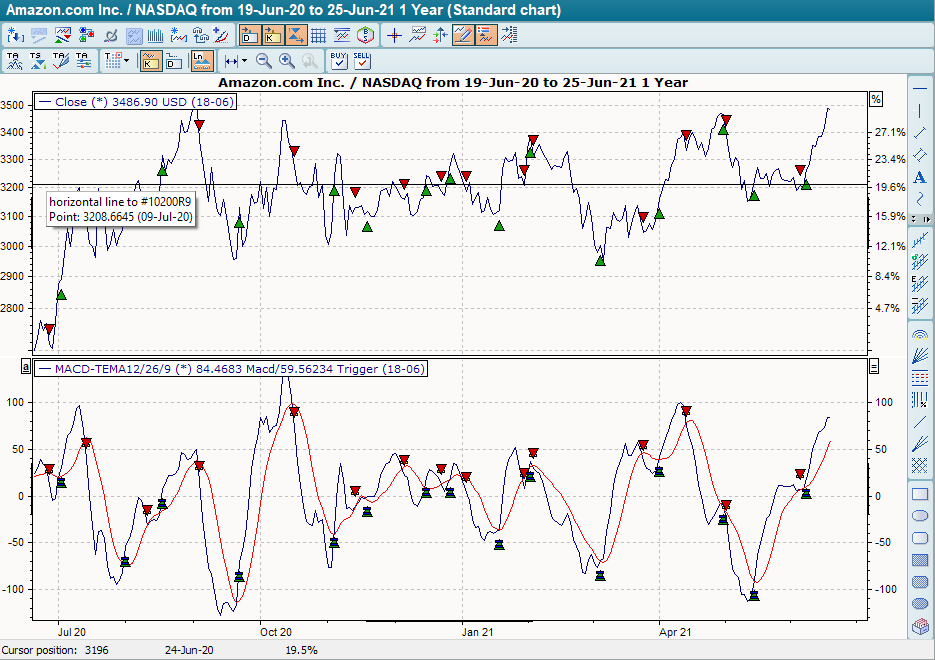
In the basic trading system "MACD-TEMA", the principle of the linear combination of its exponential averages from the TEMA was applied to the MACD in its standard setting (12/26/9). Here too, the base trading system provides buy signals when the indicator breaks through its trigger from bottom to top, and sell signals when it breaks through its trigger to the bottom.