Type
Trend follower
Short introduction
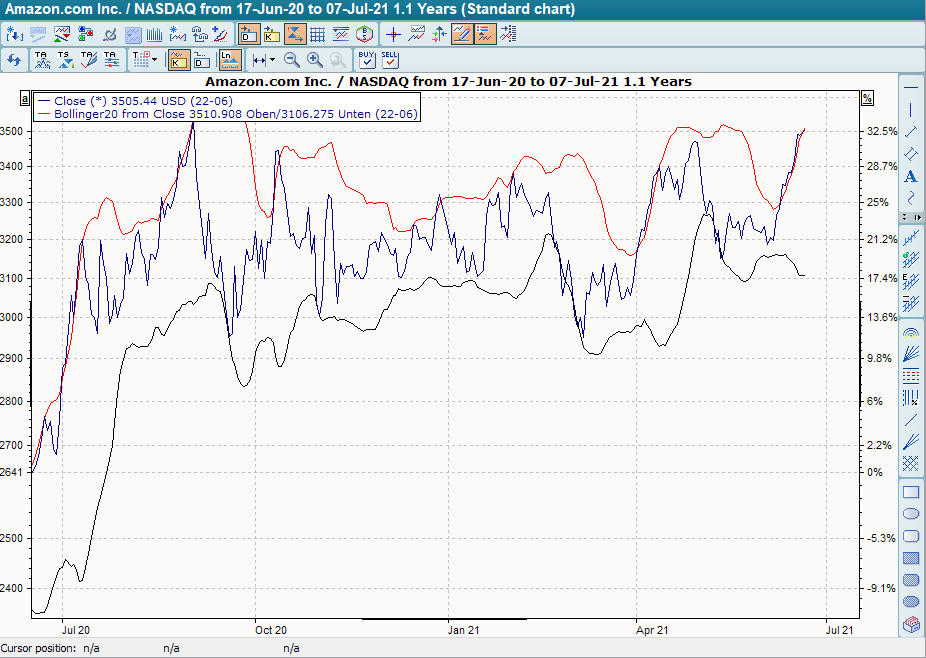
Bollinger Bands, named after their inventor John Bollinger, are based on a GD that is shifted up and down by the same amount. This indicator is used very frequently in the area of derivatives. The abbreviation is generally BB.
Statement
Bollinger Bands try to catch the prices with the help of an upper and lower limit. They use a phenomenon that is known from statistics. Most values are always close to the mean value, which is why some outliers "scatter" upwards and downwards. Gauss put this into mathematical form with his normal distribution function.
The mean value is represented by a GD, and a standard deviation is defined around this GD. The standard deviation is the average deviation from this price. The upper Bollinger Band is the GD plus standard deviation, the lower band is the GD minus standard deviation. As the standard deviation increases, the corridor between the bands becomes larger and larger. The indicator thus reacts to increasing volatility (which is nothing other than an annualized standard deviation).
Depending on the intended interpretation, you can make the corridor narrower or wider by multiplying the standard deviation by a factor.
Formula/calculation
Once a moving average has been constructed, the following formula applies:

upper band = MA + s
lower band = MA - s
where:
s = standard deviation between price and MA (moving average)
Interpretation
Due to their statistical background, the Bollinger Bands actually only provide one result. They limit the range in which a certain percentage of prices move. With a single standard deviation it is around 70%, with a double standard deviation it is around 95% of the prices. It can also be assumed that prices will repeatedly hit the upper or lower edge and then move in the opposite direction.
A trading signal cannot be derived from reaching an upper or lower band. Bollinger Bands are usually used together with other indicators, such as the MACD. If the price reaches a Bollinger Band and the development between the MACD and the base price diverges, it can be assumed that the price will move back in the direction of the other Bollinger Band.
Default setting
-
Basis: 20-day GD
-
Standard deviation: 2-fold
Basic trading systems
-
Bollinger Bands
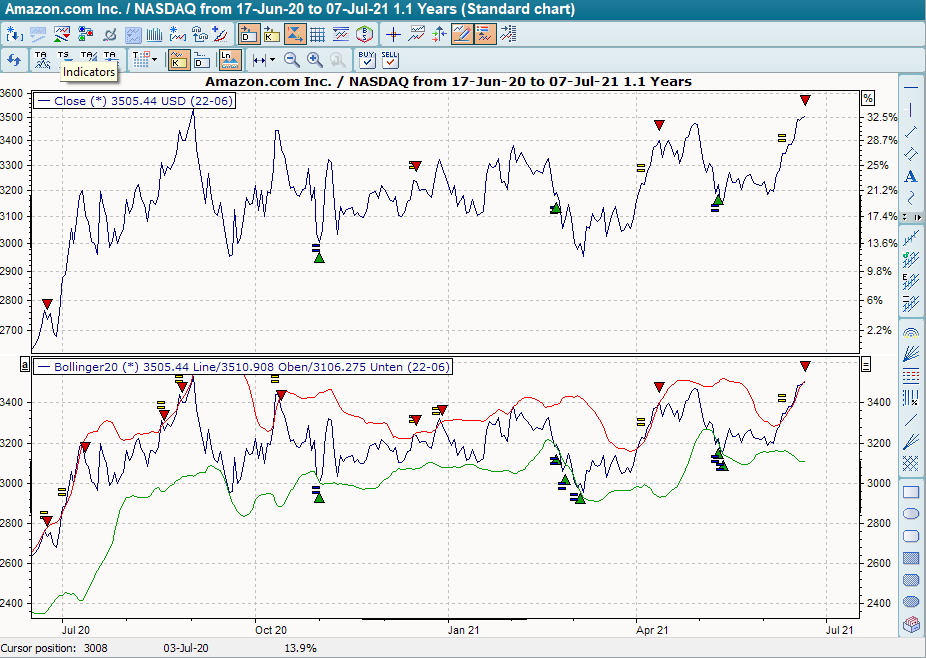
The default setting for the BHS "Bollinger Bands" is a GD period of 20 (days) and a band factor of 200 %. Buy signals are generated when the GD crosses the lower band from bottom to top. These are smoothed when the upper band is subsequently broken from bottom to top. Sell signals, on the other hand, are generated when the upper band of the GD is broken from top to bottom. These are smoothed when the lower band is subsequently broken from top to bottom.