Type
Trend follower
Short introduction
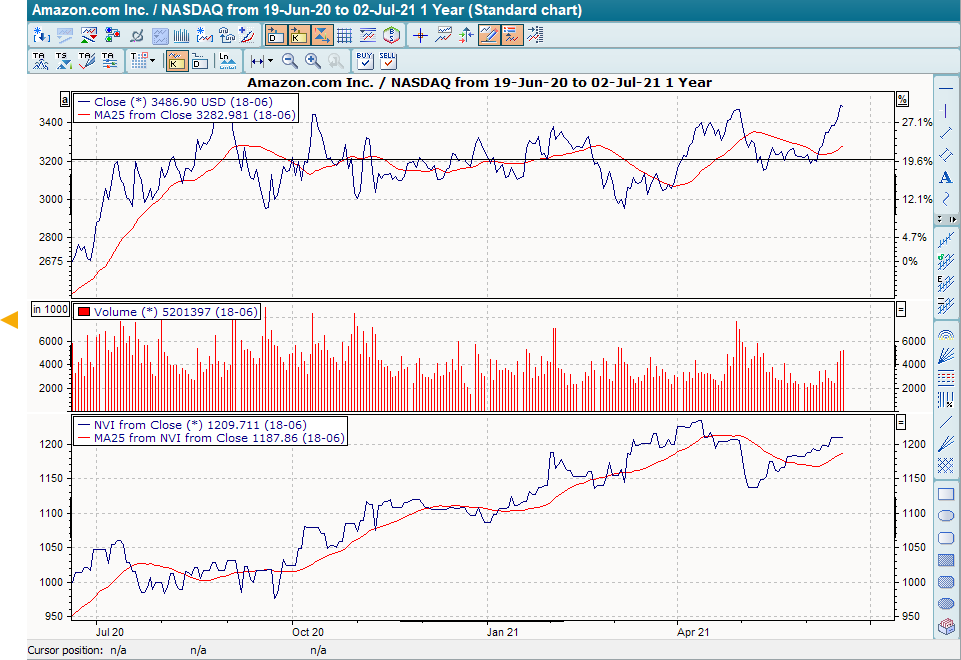
The Negative Volume Index (NVI) correlates the price change with the volume, but only if the current volume is lower than the previous day's volume. It is not known who developed this indicator.
Statement
The indicator is based on the idea that a reduced trading volume corresponds to falling prices. If turnover falls, the difference between today's close and yesterday's close is calculated and divided by yesterday's close. This value is multiplied by yesterday's indicator value and then added to yesterday's value. If the volume increases or remains the same, the indicator value remains unchanged from the previous day.
A start value must be assigned to the indicator, otherwise the value will always remain at zero. As the absolute value of the indicator is irrelevant, the value can be chosen at will. A value of 1,000 is assumed in vwd portfolio manager.
Formula/calculation
ifVn <Vn-1
thenNVIn =NVIn-1 + (((C -Cn-1) ÷Cn-1) *NVIn-1)
ifVn >Vn-1
thenNVIn =NVIn-1
Start value: 1.000
Interpretation
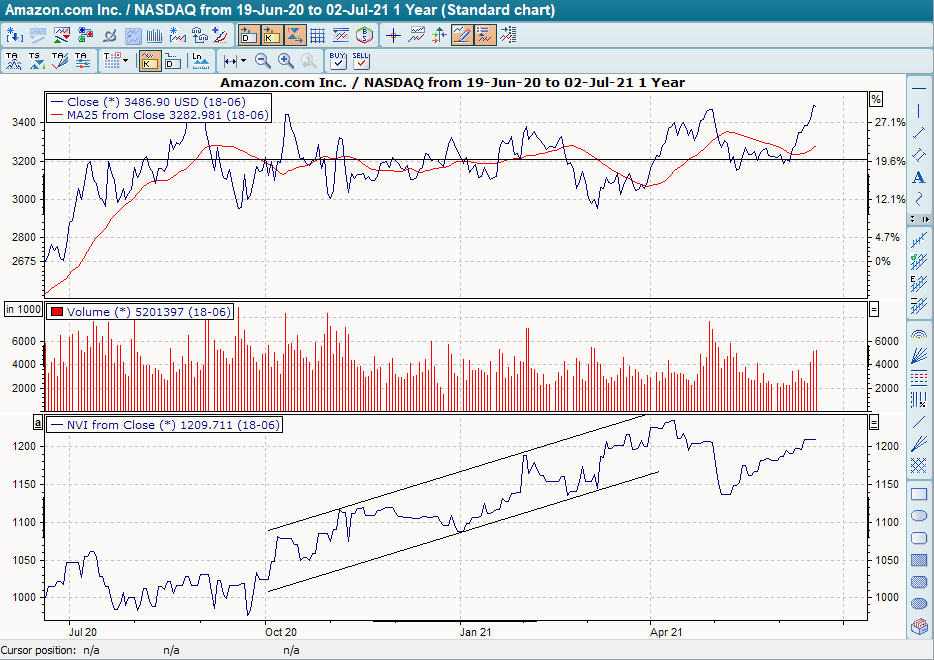
There are two different ways of interpreting the NVI:
On the one hand, you can draw your own trend lines. The interpretation rules are the same as those applied to normal price movements.
Another option is to calculate a GD on the indicator and use the intersection of the two lines as a signal generator. A buy signal is given when the indicator crosses its GD from bottom to top, a sell signal is given when the indicator crosses its GD from top to bottom.
Default setting
-
daily, if necessary also once a week
Basic trading systems
-
Negative Volume Index (NVI)
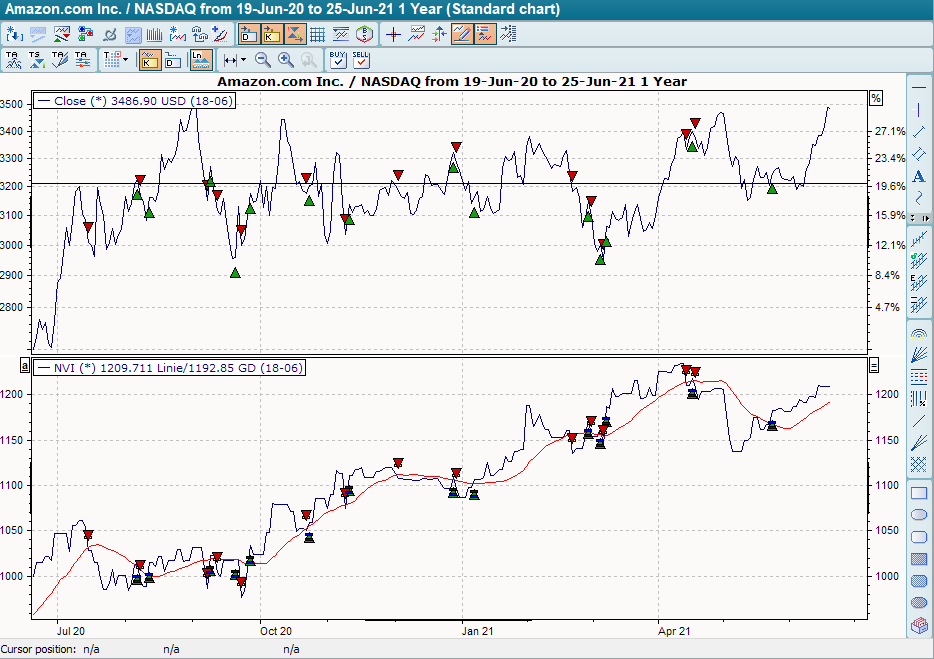
The basic trading system "Negative Volume Index (NVI)" shows the indicator and its (linear) GD 20 (red time series). The base trading system provides buy signals when the indicator breaks through its GD 20 from bottom to top and sell signals when it breaks through its GD 20 to the bottom.