Type
Oscillator
Short introduction
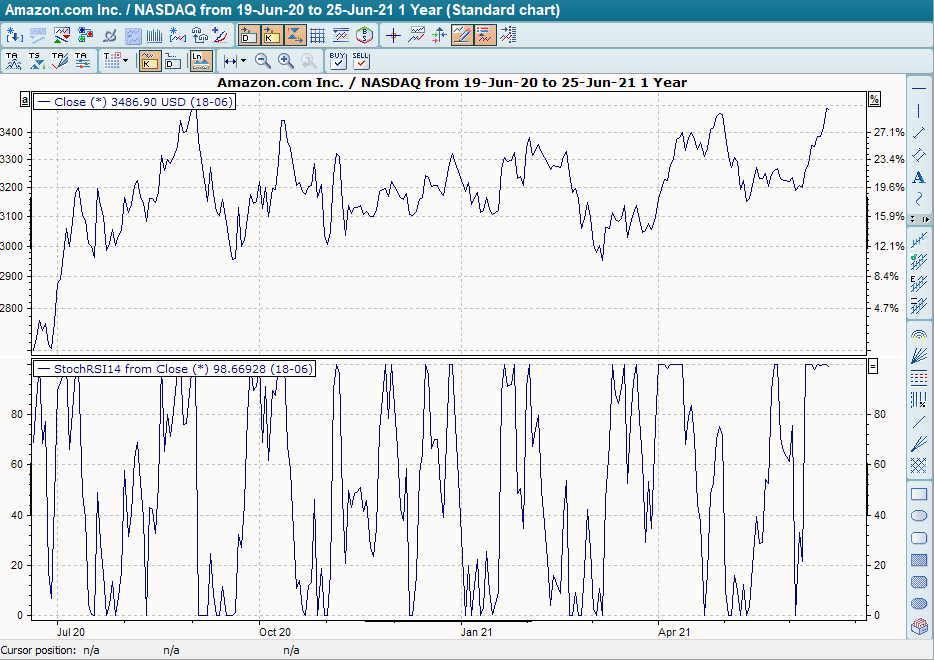
The Stochastic RSI Oscillator is a further development of the RSI by Tushar Chande and Stanley Kroll. It is created by combining the well-known stochastic indicator with the RSI by applying the stochastic calculation to the RSI curve. The result is again a curve oscillating between 0 and 100, which can be used as an overbought/oversold oscillator.
Formula/calculation
stochRSI = 100 * (RSI -Minn(RSI)) / (Maxn(RSI) -Minn(RSI))
where:
n = number of periods for RSI and stochastics
Statement/Interpretation
The following literature is recommended for information and interpretation of the Stochastic RSI Oscillator:
-
Chande, Tushar and Kroll, Stanley: Stochastic RSI and Dynamic Momentum Index, Technical Analysis of Stocks & Commodities, 5/1993
-
Chande, Tushar and Kroll, Stanley: The New Technical Trader, Wiley & Sons, 1994
-
Müller, Thomas and Lindner, Wolfgang: The big book of technical indicators, TM Börsenverlag
Default setting
-
n = 14
Basic trading systems
-
Stochastic RSI Oscillator
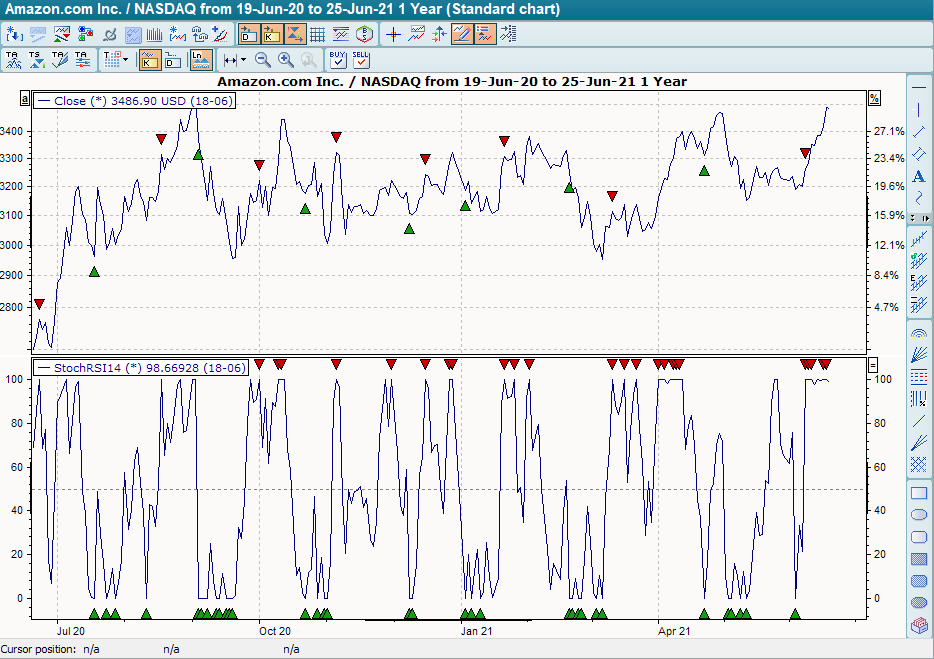
The basic trading system "Stochastic RSI Oscillator" has a default setting of 14 days for the "Period" parameter. The (center) line at +50 is drawn as an auxiliary line. The base trading system provides buy signals when the indicator reaches the value +100 and sell signals when the indicator reaches the value 0.