Type
Oscillator
Short introduction
The name for the stochastic indicator, developed by George C. Lane, is actually a misnomer, as it has nothing whatsoever to do with stochastic or statistical evaluations. Nevertheless, it is one of the most common indicators. We are not aware of a common abbreviation.
Statement
The idea behind the stochastic is that in an uptrend the daily closing prices are closer to the high of the day, while in a downtrend the closing prices are closer to the low. A trend reversal is identified by the fact that the closing prices are increasingly moving in the opposite direction. If the value then closes at the daily high or low, the trend is over.
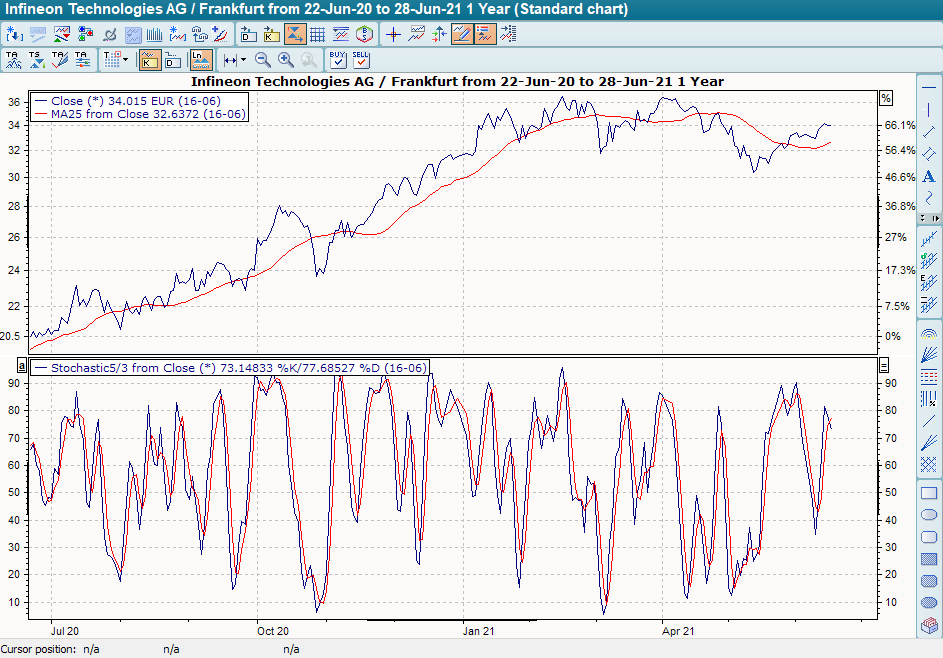
The stochastic is based on 2 lines, the %K and the %D line. The %D line is a GD of the %K line. Both lines fluctuate between 0 and 100. In addition to this indicator, known as fast stochastics, slow stochastics are also calculated. In this case, the %D line is taken as the basis and a GD is calculated on it.
Formula/calculation
Stochastics Fast:
%K=((C-Ln)/(Hn-Ln))*100
%D = ((%Dt-1*2)+%Kt )/3
Stochastics Slow:
%Kslow= %Dfast
%D = ((%Dt-1 *2)+%Kt )/3
Interpretation
A value of 0 (zero) indicates that the current closing price is the lowest price in the period under review; conversely, a value of 100 indicates that the closing price corresponds to the highest value. As with the RSI, values near the maximum indicate overbought situations, while values near the minimum indicate oversold situations. A cut of the upper extreme line (usually at 70%) from top to bottom gives a sell signal, a cut of the lower extreme line (usually at 30%) from bottom to top gives a buy signal.
In addition to this most common interpretation, the intersection of the two lines, preferably within the extreme zones, also provides signals (similar to MACD).
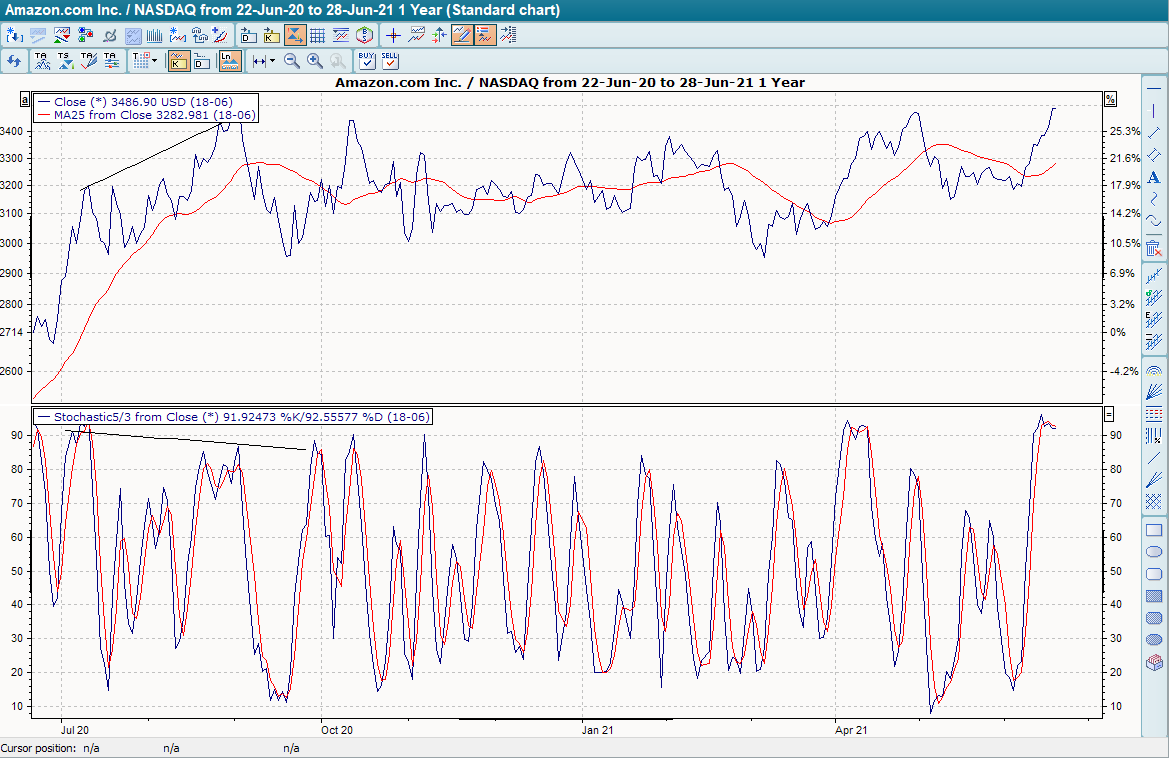
As with almost all other oscillators, you can also look for divergences between the base value and the indicator with the stochastics indicator.
Stochastics deliver their best results in trendless phases in particular, but are "overwhelmed" in strong trends.
Default setting
-
%K: 5 days
-
%D: 3 days
-
Overbought: over 70%
-
Oversold: under 30%
Basic trading systems
-
Stochastics
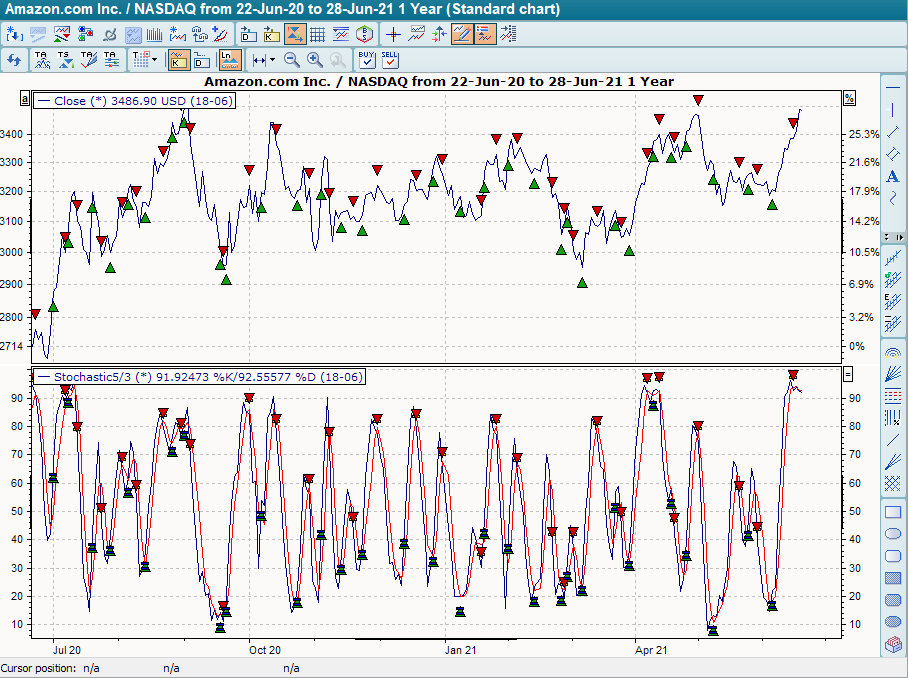
The basic trading system "Stochastic" has the default setting %K 5 days (blue time series) and %D 3 days (red time series). The "Slow" parameter is deactivated. It provides buy signals when the %K line crosses the %D line from bottom to top and sell signals when the %K line crosses the %D line from top to bottom.