Type
Oscillator
Short introduction
The Williams %R was developed by Larry Williams to indicate overbought and oversold situations. The Williams %R is strongly based on the "stochastic" indicator.
Statement
The Williams %R is intended to represent the upward or downward force inherent in prices. The indicator compares the current price with the trading range, i.e. the difference between the highest and lowest price, by calculating a quotient.
Like almost every oscillator, the Williams %R also quotes in the range between 0 and 100. A value of 100 indicates that the current price corresponds to the period low, a value of 0 means that the current price corresponds to the highest price in the observation period. Since in this case the buy signal would be given in the upper area and the sell signal in the lower area, the representation is usually reversed, it then corresponds to the "normal" representation of indicators.
Formula/calculation
%R = ((Hn-C)/(Hn-Ln))*100
where:
C = Current (closing) price
Hn = Highest price of the last n periods
Ln = Lowest price of the last n periods
Interpretation
The extreme zones in the Williams %R are usually plotted between 0 and 20 and between 80 and 100. If the indicator leaves the extreme range (oversold) between 100 and 80 from bottom to top, this is considered a buy signal; if it leaves the range between 0 and 20 (overbought) from top to bottom, this is considered a sell signal. Due to its extreme speed, the Williams %R is particularly suitable for defining entry signals. However, Williams himself limits the indicator in that he recommends that it should only be used in the direction of existing trends.
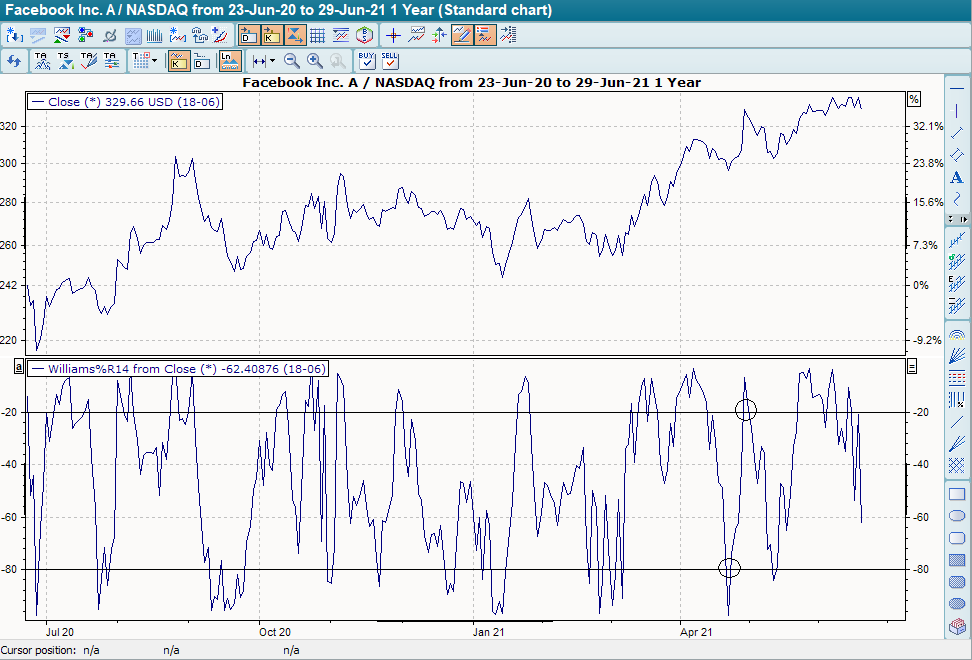
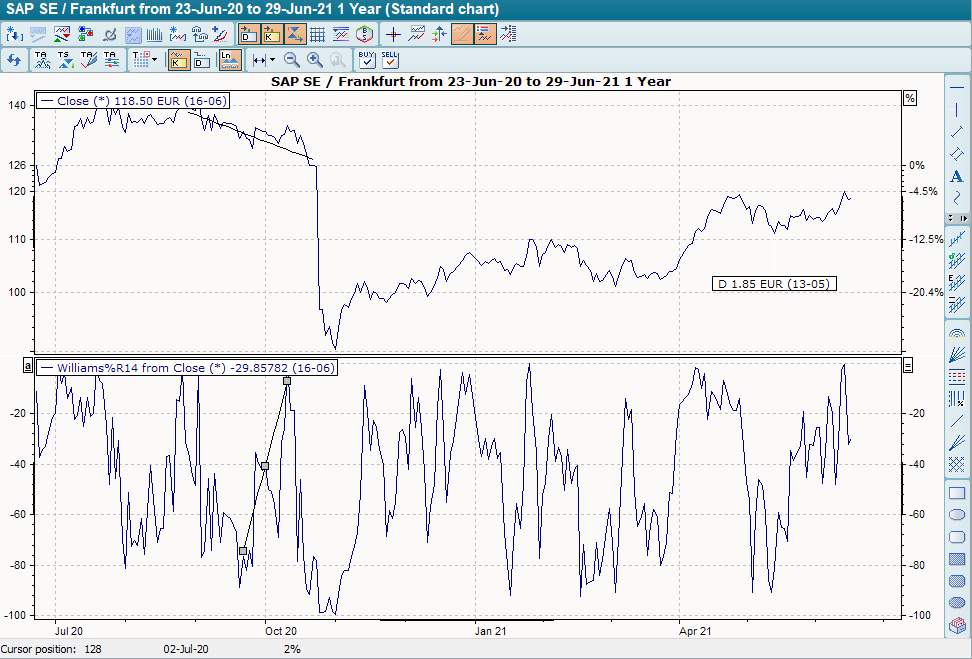
In addition to this interpretation, the indicator and the base price trend can also be examined for divergences.
Default setting
-
Extremely short: 5 days
-
In the medium term: 14 days
-
Longer term: 28 days
Basic trading systems
-
Williams' %R
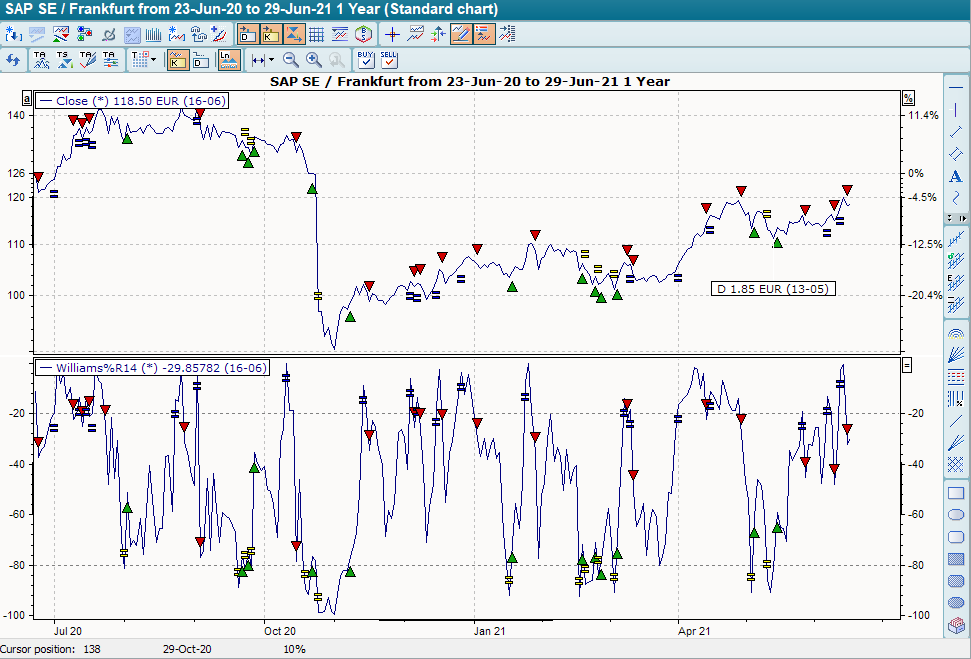
The basic trading system "Williams`%R" is created in its default setting (14 days). It provides buy signals when the indicator breaks through the line at -80 from bottom to top. The purchase is closed when this lower line is broken from top to bottom. Sell signals are given when the upper line at -20 is broken by the indicator from top to bottom. The sale is closed when this upper line is broken from bottom to top.