Type
Oscillator
Short introduction
The relative strength index according to Welles Wilder, together with the GD and momentum, is one of the most frequently used indicators. The common abbreviation is RSI. The RSI according to Wilder should not be confused with the relative strength of a security in relation to another security or an index. The RSI can assume values in the range from 0 to 100 percent.
Statement
The RSI attempts to measure the internal strength as the development of the security within a certain number of days. In the RSI, a ratio is formed between the upward and downward movements of the respective daily prices. The indicator itself always fluctuates between 0 and 100. The advantage of this standardization lies in the improved comparability of individual values. By including all prices within the period, Wilder also achieves a certain degree of smoothing; extreme prices do not distort the calculation as much.
Formula/calculation
The RSI is calculated in several steps:
Within the observation period, the differences between the upward closing prices (close today > close yesterday) and the downward closing prices (close today < close yesterday) are totaled and then divided by the number of observations minus one (when observing n days, there can only be n-1 changes). The result is the average daily value for the upward and downward force of the underlying security.
The "relative strength" is calculated by dividing the average upward force by the average downward force. The RSI is calculated by subtracting the quotient of 100 divided by the sum of one plus "relative strength".
IfCt >Ct-1, then u =Ct -Ct-1 and d = 0.
IfCt <Ct-1, then d =Ct-1 -Ct and u = 0.
U = ((n - 1) ×Ut-1 + u) ÷ n
(U = average of the upward closing price movements of the last n days)
D = ((n - 1) ×Dt-1 + d) ÷ n
(D = average of the downward closing price movements of the last n days)
RS = U ÷ D
RSI = 100 - 100 ÷ (1 + RS)
Interpretation
If the RSI reaches its minimum value of 0 (zero), the stock has no intrinsic strength. Prices therefore fell exclusively during the period under review. A value of 100 means that prices have risen exclusively. Values close to 0 (zero) indicate an oversold base stock, values close to 100 indicate an overbought market. A counter-reaction can be expected at such points. However, the real signal is only generated when the indicator leaves the extreme range around the minimum or maximum again.
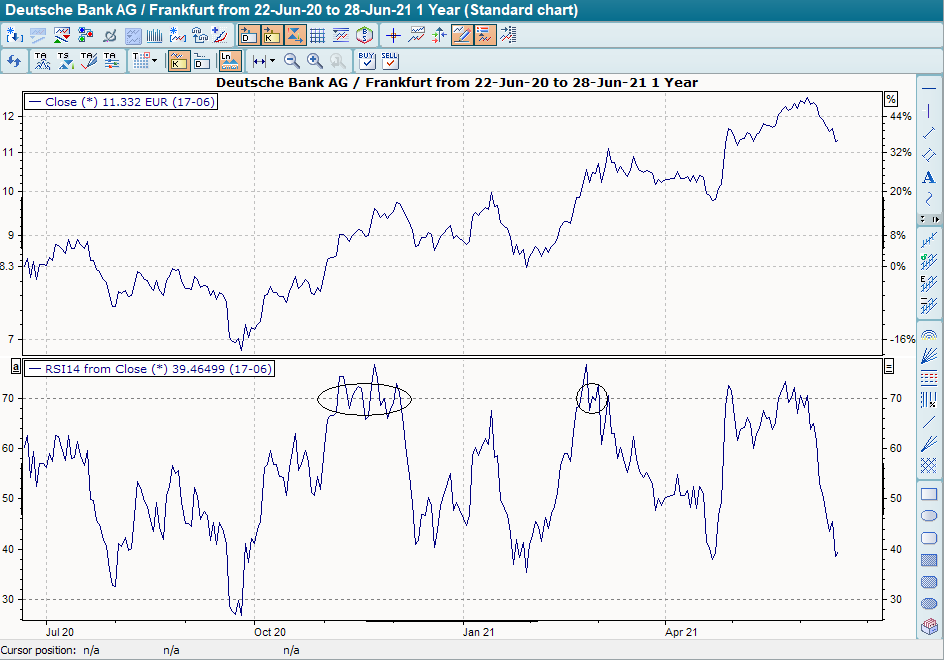
The RSI can also be analyzed for technical chart formations , as the RSI forms these more often than the underlying stock. The interpretation is analogous to the formations in the base title.
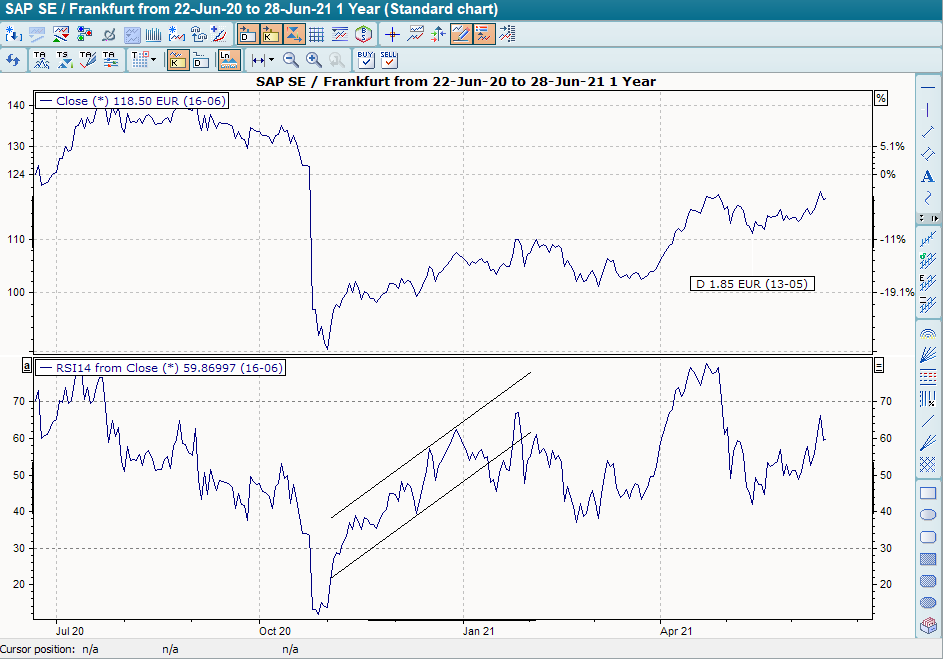
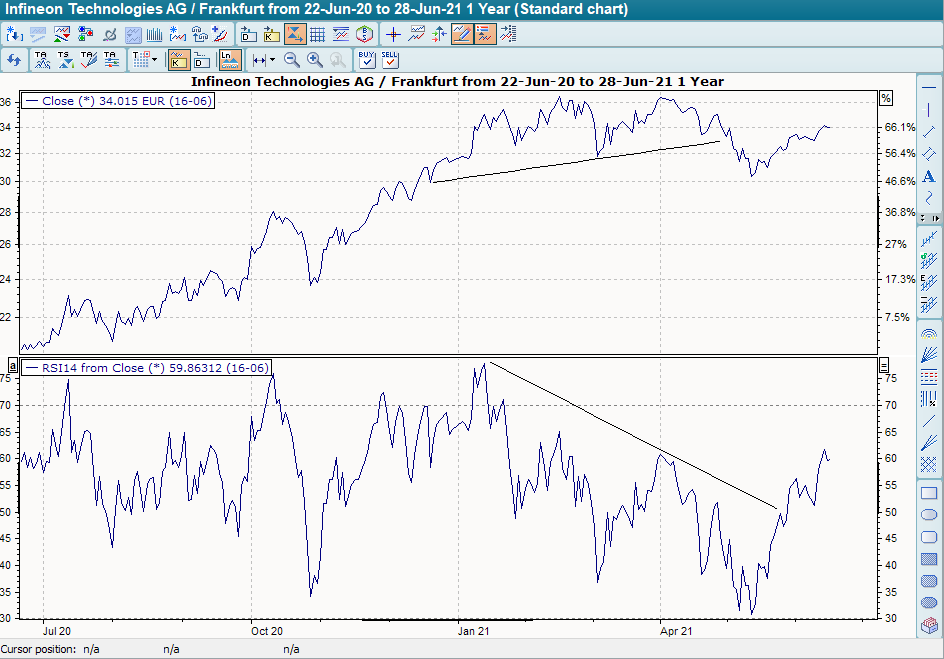
As with other indicators, the development of divergences between the indicator and the underlying value indicates a change in trend.
Default setting
-
14 days
-
Overbought: over 70%
-
Oversold: under 30%
Basic trading systems
-
Relative Strength Index (RSI)
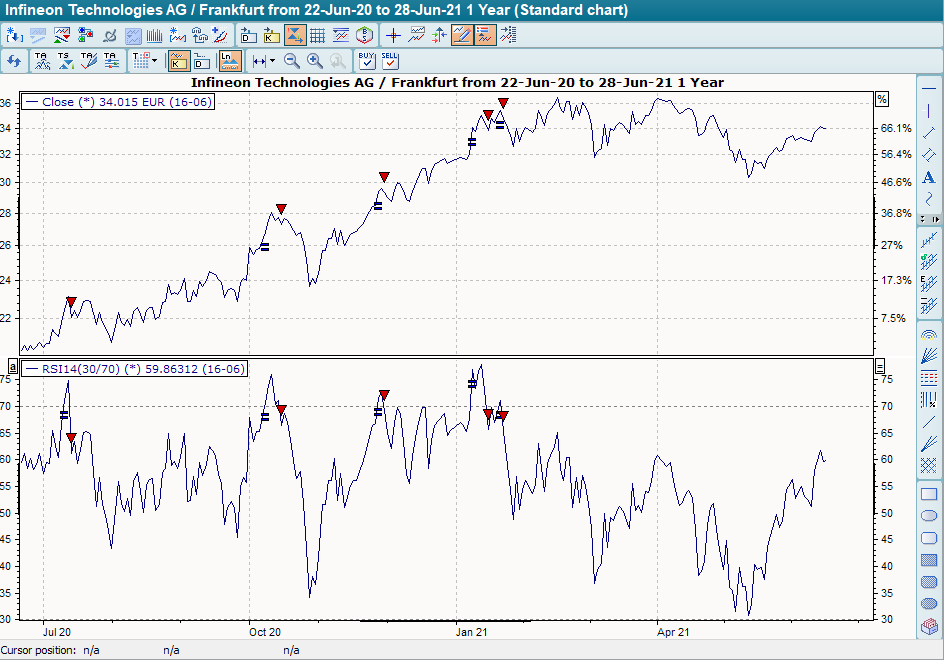
The basic trading system "Relative Strength Index (RSI)" has a default setting of 14 days. In addition, two auxiliary lines are drawn at 70 and 30. It provides buy signals when the indicator breaks through the line at 30 from bottom to top. These are closed out if the indicator then breaks through this lower line from top to bottom. The base trading system provides sell signals when the indicator breaks through the upper line at 70 from top to bottom. Similarly, these are closed out if the indicator then breaks through the line at 70 from bottom to top.