Type
Oscillator
Short introduction
Momentum is certainly the most important and most widely used oscillator in the group of oscillators - worldwide. The calculation is trivial, but it can be used sensibly in many cases with different variations. The usual abbreviation is "MOM".
Statement
Momentum attempts to measure the strength of a price movement by simply subtracting the price of a few days ago from the current price. The indicator curve thus fluctuates around the zero line. The purpose of this subtraction is to recognize new trends, which often try to establish themselves through large price movements. In the course of the trend, the strength, and thus the absolute value of the momentum, often decreases.
Instead of subtracting the prices, you can also divide the two prices, the statement remains identical, only the base line changes from 0 (zero) to 100.
Formula/calculation
Momentum =Ct -Ct-n+1
or also:
Momentum = (Ct -Ct-n+1) * 100
Interpretation
Momentum offers a wide range of possible interpretations. The most important foundations on which individual ideas can be built are described below.
Momentum in negative territory always indicates a downward trend. If the momentum continues to fall, the force of the downward movement increases even further. Rising momentum below the zero line indicates a weakening of the downward trend and thus a possible new, upward trend.
Positive momentum indicates an upward trend in the base stock; rising momentum in this area continues to point to a strengthening of the upward movement. If the momentum falls, the upward trend could soon come to an end.
The "classic" signal is provided by the breakthrough of the midpoint line. From bottom to top it is a buy signal, from top to bottom a sell signal. To avoid false signals, two upward or downward auxiliary lines can be drawn. In this case, a signal should only be valid when one of these auxiliary lines is broken through.
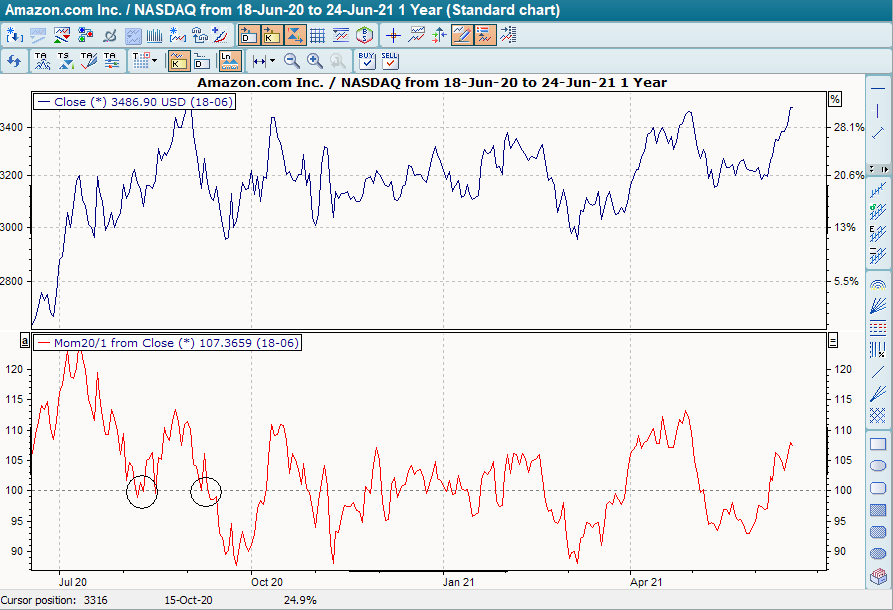
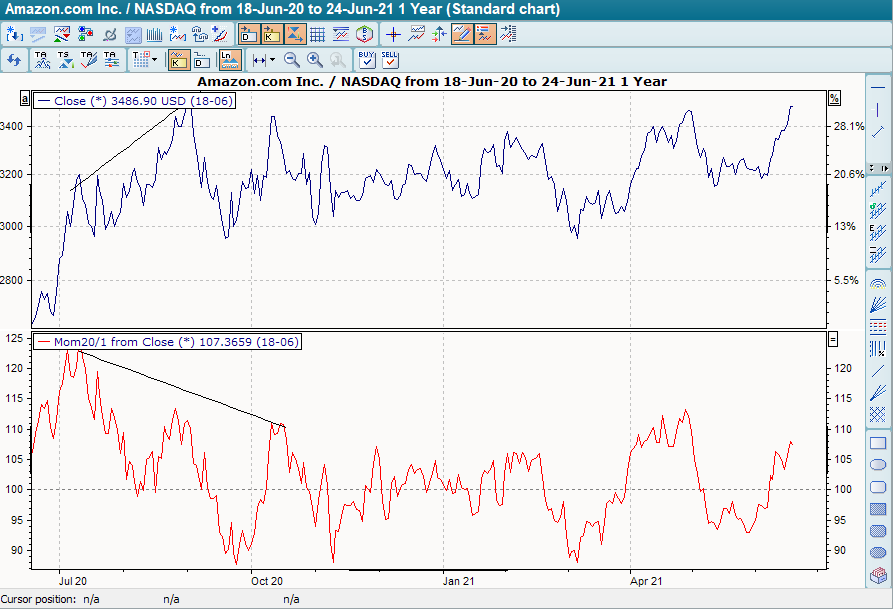
Another application is the search for divergences between price performance and momentum. If the momentum is still forming new highs or lows, but the base price is no longer, a trend change can be expected soon.
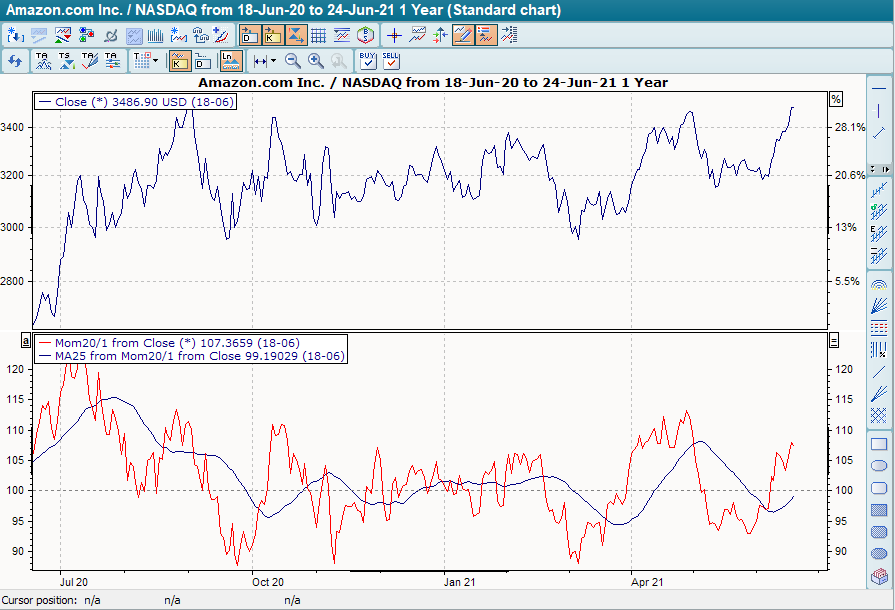
However, it is also interesting to smooth the momentum with a GD, to use a GD of the momentum to generate signals (similar to the MACD) or simply to apply the momentum not to the price but to another indicator, such as a GD.
Default setting
-
Depending on the application, the standard settings for momentum vary greatly; however, the most common values are 10 or 25 days.
Basic trading systems
-
Momentum
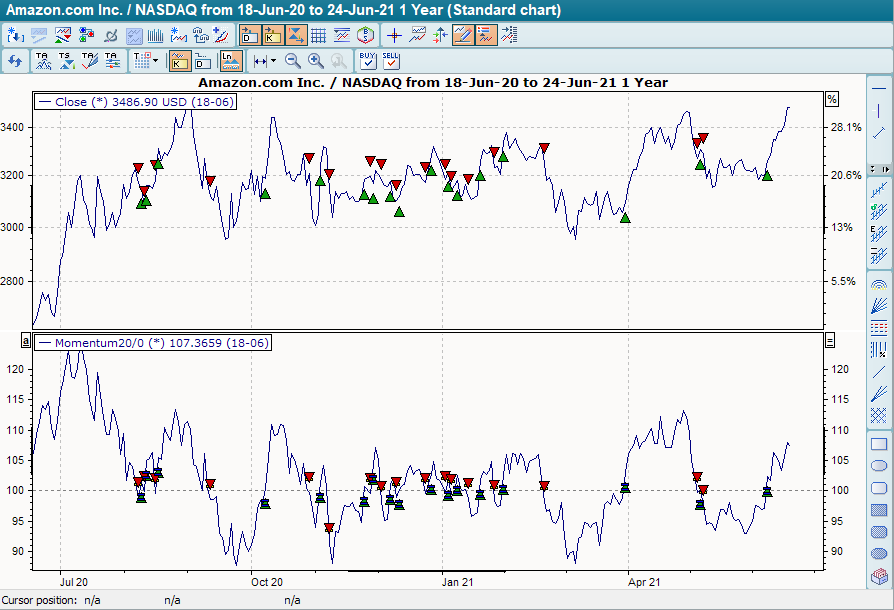
In the "Momentum" base trading system, the default setting for the period 20. The period for the (linear) GD, on the other hand, is set to 0 by default. The line at +100 also serves as a signal line. The base trading system provides buy signals when the indicator breaks through this line at +100 from bottom to top, and sell signals when it breaks through to the bottom.