Type
Oscillator
Short introduction
Pring's KST (Know-Sure-Thing), developed by Martin J. Pring, is in principle an improvement of the Momentum or ROC.
Statement
Pring assumes that various trends are active in the market at the same time, whereby each trend can be at a different stage. To summarize these individual trends, the indicator calculates four ROCs based on different time periods. These ROCs are smoothed, then weighted and finally added together. The weighting increases with the number of days over which the ROC is calculated. The result is a curve that fluctuates around the zero line with unlimited minima and maxima.
Formula/calculation
KST =MAs(ROCt) *w1 +MAu(ROCv) *w2 +MAw(ROCx) *w3 +MAy(ROCz) *w4
where:
w1,w2,w3,w4 = weighting factors
Interpretation
Pring's KST can be interpreted in a similar way to the other oscillators. There are therefore two standard options: the cut with the GD and the search for divergences.
A buy signal is given when the Pring's KST crosses its GD from bottom to top, a sell signal is given when the Pring's KST crosses its GD from top to bottom
Another application is the search for divergences between the price trend and Pring's KST. If the Pring's KST is still forming new highs or lows, but the base price is no longer, a trend change can be expected soon.
Default setting
-
The standard settings for Pring's KST vary greatly depending on the application. The default settings suggested by Pring are shown in the following table:
|
|
s |
t |
w1 |
u |
v |
w2 |
w |
x |
w3 |
y |
z |
w4 |
|---|---|---|---|---|---|---|---|---|---|---|---|---|
|
short |
10 |
10 |
1 |
10 |
15 |
2 |
10 |
20 |
3 |
15 |
30 |
4 |
|
medium |
10 |
10 |
1 |
13 |
13 |
2 |
15 |
15 |
3 |
20 |
20 |
4 |
|
long |
6 |
9 |
1 |
6 |
12 |
2 |
6 |
18 |
3 |
9 |
24 |
4 |
Basic trading systems
-
Pring`s KST
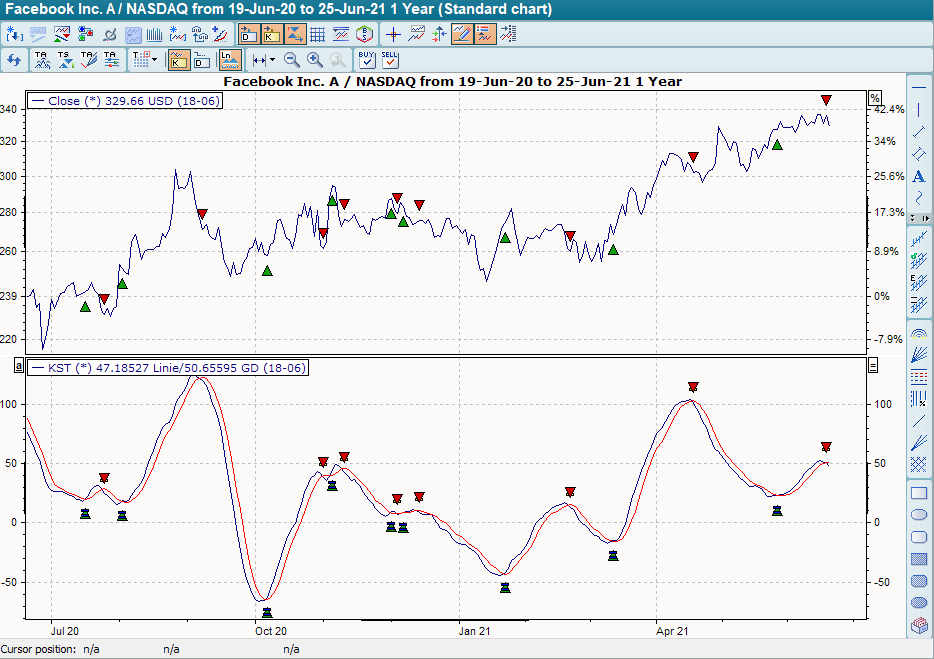
In the basic trading system "Pring's KST", the default settings for the ROC and GD periods are 10, 13, 15 and 20 days. The second time series next to the indicator is its linear GD 5 (red time series).
The base trading system provides buy signals when the indicator breaks through its GD 5 from bottom to top. On the other hand, it provides sell signals when the indicator breaks through its GD 5 from top to bottom. The close-out signals are hidden in the screen for a better overview using the command SIGNALS PHASE WISE, as they coincide with the following buy or sell signals.