Type
Oscillator
Short introduction
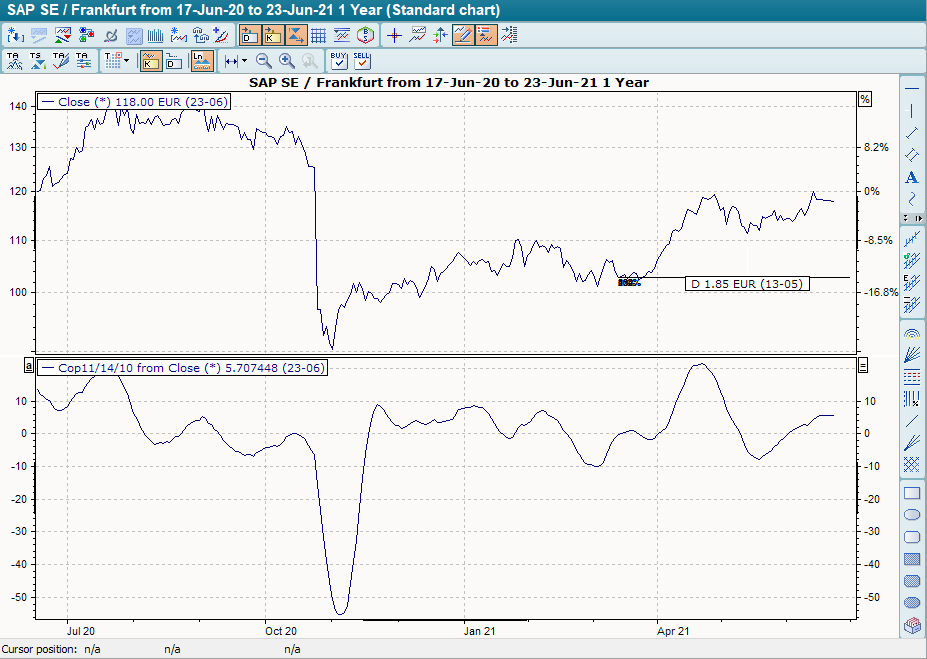
The Coppock indicator, developed by Edwin Coppock, is based on momentum and GD. It is used to recognize long-term (multi-year) trends; it is rather unsuitable for short-term trends. There is no common abbreviation.
Statement
The Coppock measures long-term trends by adding two long-term momentums. A weighted GD is formed on the basis of this total. As the basis of the indicator is formed by momentum, the Coppock also oscillates around the zero line.
Formula/calculation
Coppock =WMAx(ROCy +ROCz)
where:
WMA = Weighted Moving Average (weighted moving average)
Interpretation
The Coppock is interpreted in two different ways. In the standard interpretation, a downward turn of the line above the zero line is a sell signal, while an upward turn of the line below the zero line is a buy signal.
Another option is to form a further, long-term GD on the basis of the coppock. In this case, the intersection of the GD with the Coppock is evaluated as a signal.
Default setting
-
Momentum1: 10 weeks
-
Momentum2: 11 weeks
-
GD: 14 weeks
Basic trading systems
-
Coppock
Unknown Attachment
In its standard setting, the BHS "Coppock" provides buy signals at reversal points from falling to rising trends of the indicator below the zero line. If the price trend of the indicator reverses from rising to falling above the zero line, the BHS provides a sell signal.
To hide duplicate signals, select the indicator time series and choose the command SIGNALS PHASE WISE in the context menu.