Type
Oscillator
Short introduction
With his Momentum Oscillator, Tushar Chande essentially reproduces the ideas of Wilder's RSI by replacing the exponential smoothing in its calculation with a simple linear smoothing (and shifting the display range downwards so that the indicator oscillates around the zero line instead of being plotted between 0 and 100). The CMO is therefore a momentum oscillator and is mainly used as an overbought/oversold indicator via its extreme zones. Due to its relationship with the RSI, however, it is open to various other interpretations.
Formula/calculation
Within the period under review, the amounts of the price movements are totaled separately for up and down days. The CMO is then the share of upward price movements in the sum of all price movements, whereby the result is normalized in such a way that a tie between upward and downward movements falls on the zero axis.
u=Ct -Ct-1 and d=0 ifCt >Ct-1
d=Ct-1 -Ct and u=0 ifCt <Ct-1
Ut =ut + ... +ut-n+1
Dt =dt + ... +dt-n+1
CMO = 100 * (U - D) / (U + D) = 100 * (2*U / (U + D) -1)
where:
U = sum of the upward closing price movements of the last n days
D = Sum of the downward closing price movements of the last n days
Note:
The formula of the RSI is simplified considerably further by the use of linear smoothing than is used in the definition of the CMO. The term U+D is the sum of the period-related movement amounts, while the term U-D corresponds to the n-period momentum. The distinction between up and down days can therefore be omitted:
CMOt = 100 * (Ct -Ct-n) / (|Ct -Ct-1|+ (|Ct-1 -Ct-2|+ ... +|Ct-n+1 -Ct-n|)
Because of this connection, the CMO is sometimes also referred to as "fractal efficiency" (see Polarized Fractal Efficiency).
Statement/Interpretation
The following literature is recommended for the statement and interpretation of the CMO:
-
Chande, Tushar and Kroll, Stanley: The New Technical Trader, Wiley & Sons, 1994
-
Müller, Thomas and Lindner, Wolfgang: The big book of technical indicators, TM Börsenverlag
-
Florek, Erich: New Trading Dimensions, FinanzBuch Verlag, 2000
-
Achelis, Steven B.: Technical Analysis from A to Z
Default setting
-
n = 14
Basic trading systems
-
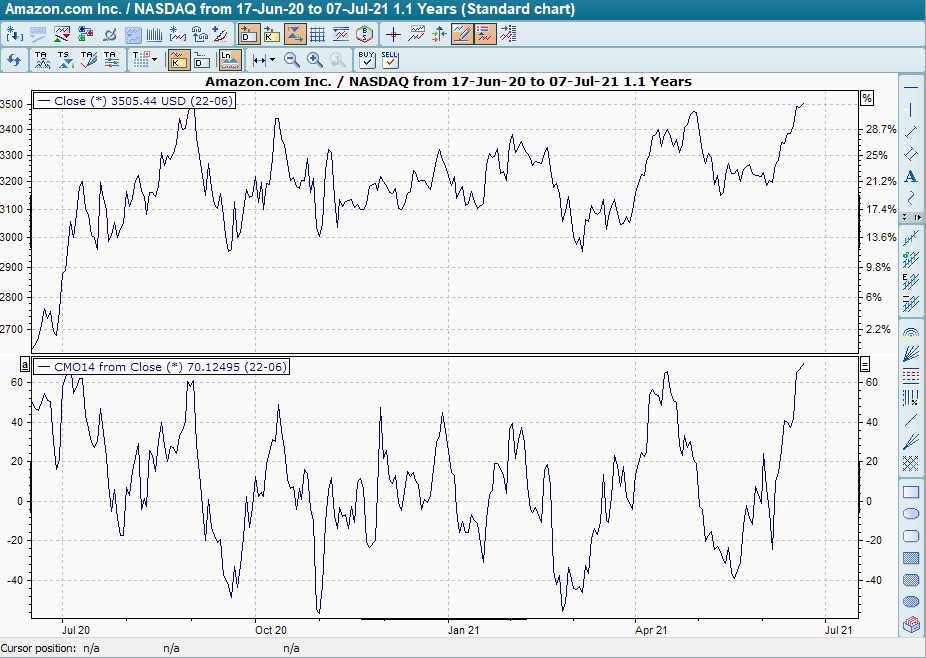
Chande Momentum Oscillator (CMO)
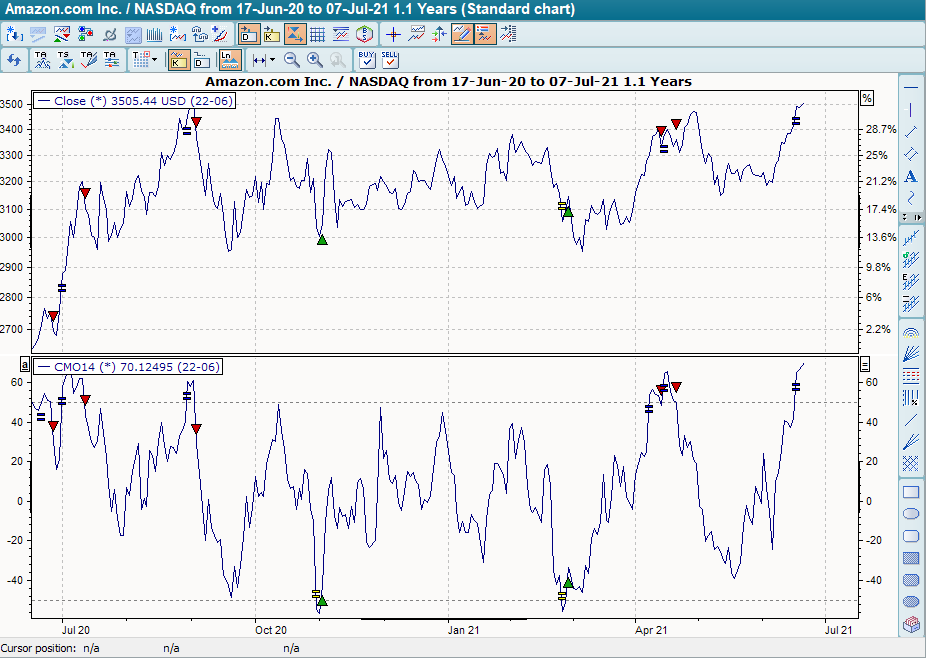
The base trading system "Chande Momentum Oscillator (CMO)" has a default setting of 14 days. The two auxiliary lines at +50 and -50 are also shown. The base trading system provides buy signals when the indicator crosses the line at -50 from bottom to top. These are closed out when the line at -50 is broken from top to bottom. It provides sell signals when the CMO crosses the line at +50 from top to bottom. These are closed in the same way if the line at +50 is broken from bottom to top.