Type
Oscillator
Short introduction
The Range Expansion Index was introduced by Thomas R. DeMark in 1994 and is one of a whole series of his indicator variants. In DeMark's view, indicators lose value when they are used by the masses, which explains his move away from standard indicators and his tendency to develop his own. With the Range Expansion Index, he wanted to realize an oscillator that would strike in periods of rising or falling prices and that would rest both in sideways phases and in excessive trend phases. The REI is based on a momentum concept that evaluates the movement of the range qualitatively and quantitatively.
Formula/calculation
FAt = (Ht ≥ Min(Lt-5,Lt-6)) and (Lt ≤ Max(Ht-5,Ht-6))
FBt = (Ht-2 ≥ Min(Ct-7,Ct-8)) and (Lt-2 ≤ Max(Ct-7,Ct-8))
DHt =Ht -Ht-2
DLt =Lt -Lt-2
FDS = DH + DL , if FA or FB
FDS = 0, otherwise
REI = 100*SUM5 (FDS) /SUM5 ( | DH | + | DL |)
where:
FA = filter condition for gap
FB = filter condition for "Close is in range"
DH = 2-period high difference
DL = 2-period low difference
FDS = filtered difference sum
Statement/Interpretation
The following literature is recommended for the statement and interpretation of the Range Expansion Index:
-
DeMark, Thomas R.: New Market Timing Techniques, Wiley, 1994
-
DeMark, Thomas R.: The New Science of Technical Analysis, Wiley, 1997
-
DeMark, Thomas R.: The TD Range Expansion Index (TD REI), Technical Analysis of Stocks & Commodities, 8/1997
-
Müller, Thomas and Lindner, Wolfgang: The big book of technical indicators, TM Börsenverlag
Default setting
-
see formula; variation is possible
Basic trading systems
-
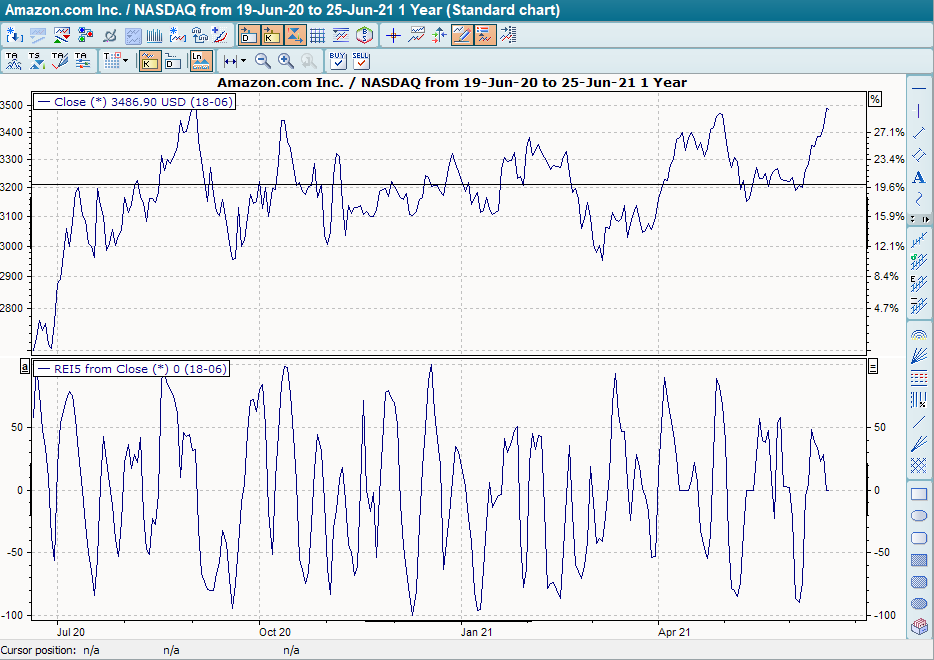
Range Expansion Index (REI)
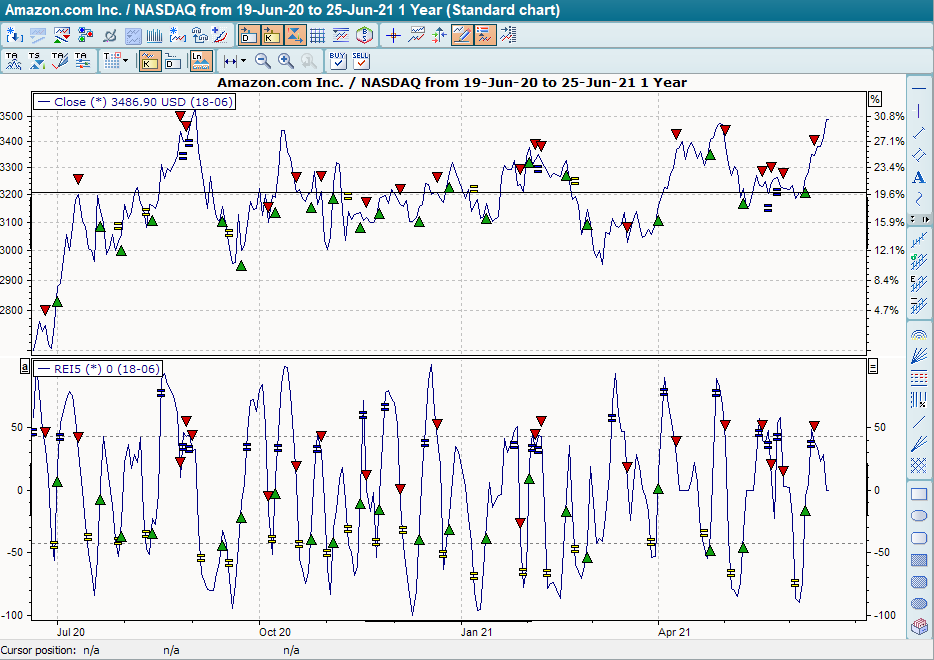
The basic trading system "Range Expansion Index (REI)" has the following standard settings for the period 5. Two auxiliary lines are drawn at +43 and -43. The base trading system provides buy signals when the REI breaks through the line at -43 from bottom to top. The purchases will be closed out if it breaks through this line again to the downside. It provides sell signals when the REI breaks through the line at +43 from top to bottom. The sales will be closed if it breaks through this line again to the upside.