Type
Turnover indicator (trend follower/oscillator)
Short introduction
Larry Williams developed the Williams Variable Accumulation Distribution (WVAD) as a sales indicator to measure upward or downward pressure.
Statement
The WVAD fluctuates upwards and downwards around the zero line. The calculation is made by dividing the difference between the close and the open by the difference between the daily high and the daily low (always greater than or equal to zero). This quotient must be between -1 and +1, which results from the exchange rates used. As the difference between Close and Open can be positive and negative, a positive or negative value can arise. This value is first multiplied by the daily turnover and then added to the previous day's value on an ongoing basis.
Formula/calculation
WVAD = (((C-0)/(H-L))*V)+I
where:
I = WVAD value previous day
Interpretation
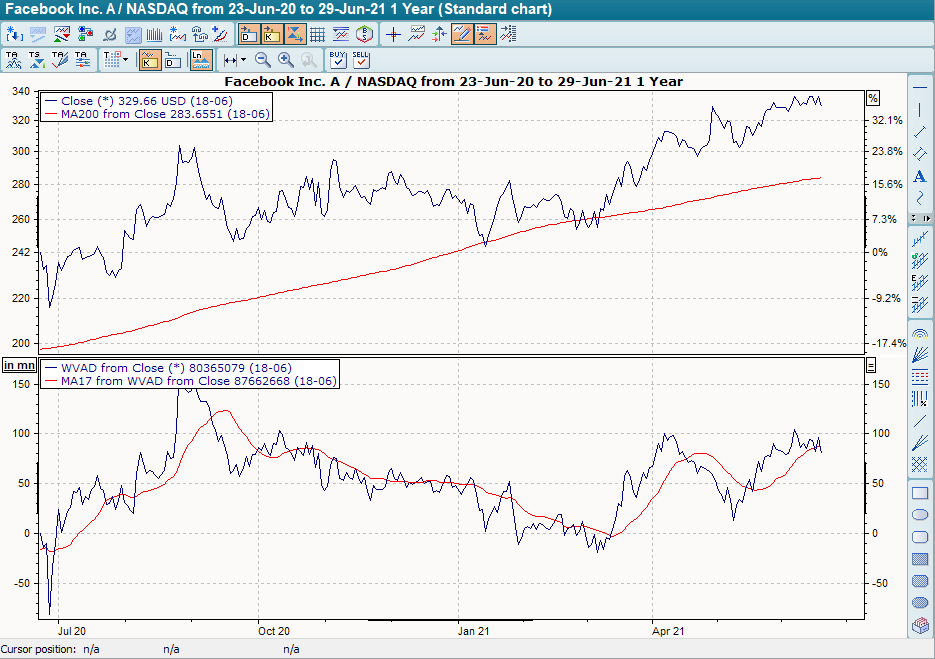
The WVAD is a simple oscillator on price weighted by turnover. To a certain extent, this weighting also makes it possible to speak of a trend follower. This gives rise to the following possible interpretations:
A buy signal is given when the WVAD crosses the zero line from bottom to top, a sell signal is given when the WVAD crosses the zero line from top to bottom.
Another option is to calculate a GD via the WVAD and use the intersection of the two lines as a signal generator. A buy signal is given when the WVAD crosses its GD from bottom to top, a sell signal when the WVAD crosses its GD from top to bottom.
As with other oscillators, leaving extreme zones can also be used as a signal generator. However, the problem is that the WVAD has no fixed limits, so you have to define the extreme zones yourself, which requires some experience! Leaving the upper extreme range is a sell signal, leaving the lower extreme range is a buy signal.
The first values calculated by the indicator should be ignored, as it first has to stabilize. What is particularly interesting about this indicator is that it also includes sales in its interpretation. It can therefore provide very early signals, as falling turnover often indicates a change in trend.
Default setting
-
None, daily calculation
Basic trading systems
-
Williams Variable A/D
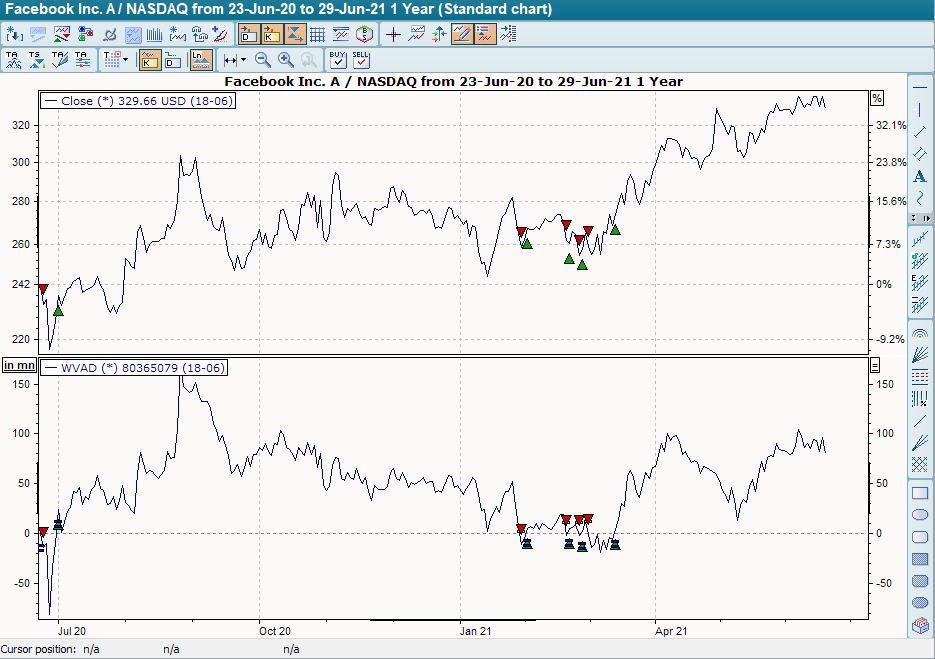
The "Williams Variable A/D" basis trading system provides buy signals when the indicator breaks through the zero line to the upside, i.e. assumes positive values. It provides sell signals when the indicator breaks through the zero line to the downside, i.e. assumes negative values. For a better overview, the signals for smoothing have been hidden in the screen example using the command SIGNALS PHASE.