Type
Oscillator
Short introduction
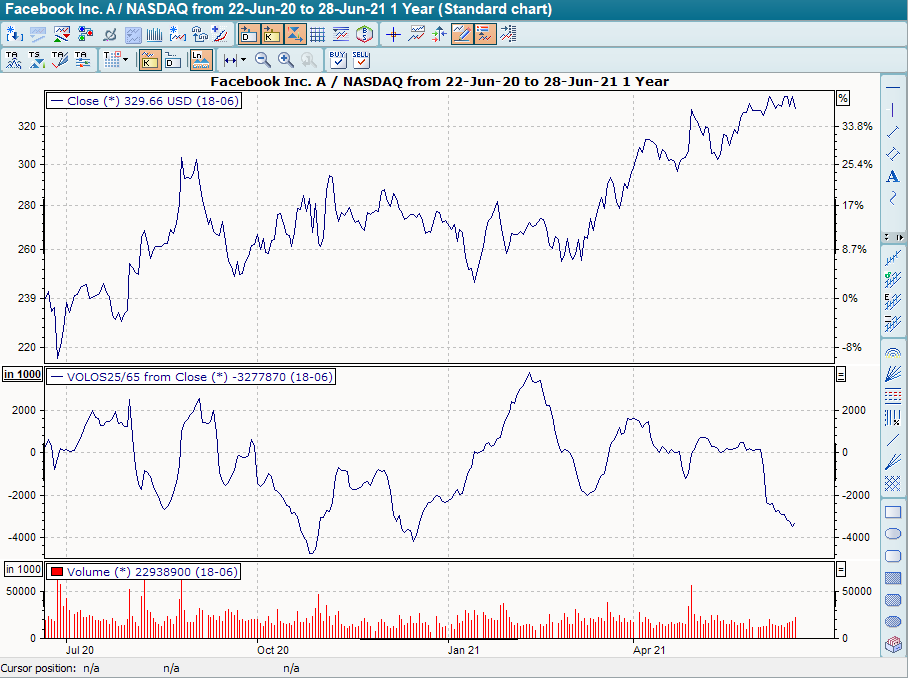
The Volume Oscillator is not an independent indicator, but the difference between two indicators, generally two GDs. The Volume Oscillator differs from the Price Oscillator in that it calculates GDs of turnover instead of prices.
Statement
By forming the difference, the indicator values fluctuate openly upwards and downwards around the zero line. A signal is thus generated by crossing the zero line.
In the calculation, the longer, "slower" GD is subtracted from the shorter, "faster" GD.
Formula/calculation
Volume Oscillator =MAx(V) -MAy(V)
where:
V = Volume
MAx = Moving Average, shorter period
MAy = Moving Average, longer period
Interpretation
Since the indicator is generally formed on the basis of two GDs, we limit our interpretation to this case as well.
A value above the zero line indicates that the shorter GD is above the longer one and thus the sales volume is increasing. Conversely, a value below the zero line indicates that the shorter GD is below the longer one and therefore the sales volume is falling. The indicator does not provide a direct signal, but it is interesting to see whether the rising turnover is also accompanied by falling or rising prices.
If this is the case, the prevailing trend in the underlying stock is definitely in order. If divergences form, a trend reversal can be expected.
Another option is to apply trend lines to the volume oscillator itself and monitor them for breakthroughs, so you get the corresponding signals a little earlier.
Default setting
-
None, depends entirely on the period examined, similar to pure GDs
Basic trading systems
-
None