Type
Oscillator
Short introduction
Larry Williams developed the Ultimate Oscillator. It is a combination of the Accumulation/Distribution Oscillator he developed and Wilder's RSI. With this combination, Williams tries to narrow down the phases of exaggeration more precisely.
Statement
Oscillators generally have the disadvantage that they indicate upward or downward exaggerations too early. The Ultimate Oscillator aims to eliminate this disadvantage by calculating three different time periods with different weightings and adding them together. The result is an indicator that fluctuates between 0 and 100, with 50 as the center line. The calculation is so complicated that no derivation is given here. The formula itself can be found in the next section.
Formula/calculation
Bt =Ct -TLt
TRt =THt -TLt
SBx =Bt +Bt-1 + ... +Bt-x+1
SBy =Bt +Bt-1 + ... +Bt-y+1
SBz =TRt +TRt-1 + ... +TRt-z+1
STRx =TRt +TRt-1 + ... +TRt-x+1
STRy =TRt +TRt-1 + ... +TRt-y+1
STRz =TRt +TRt-1 + ... +TRt-z+1
ULT = (SBx ÷STRx) × 4 + (SBy ÷STRy) × 2 + (SBz ÷STRz)
where:
Bt := Buying pressure time t
Ct := Closing price time t
TLt := True low time t; daily low or previous day's closing price, whichever is the lower
THt: = True high time t; daily high or previous day's closing price, whichever is the higher
TRt := True Range time t
SB := Sum of the respective "Buying Pressure" values for the time periods x, y and z
STR := Sum of the "True Range" values for the time periods x, y and z
ULT := Ultimate Oscillator
Interpretation
There are three different possible interpretations:
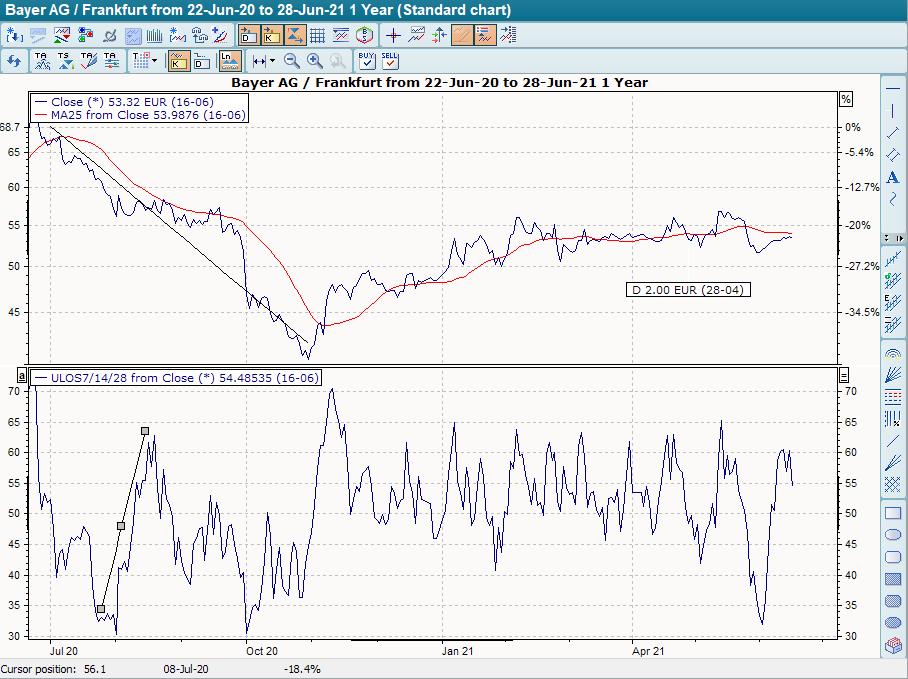
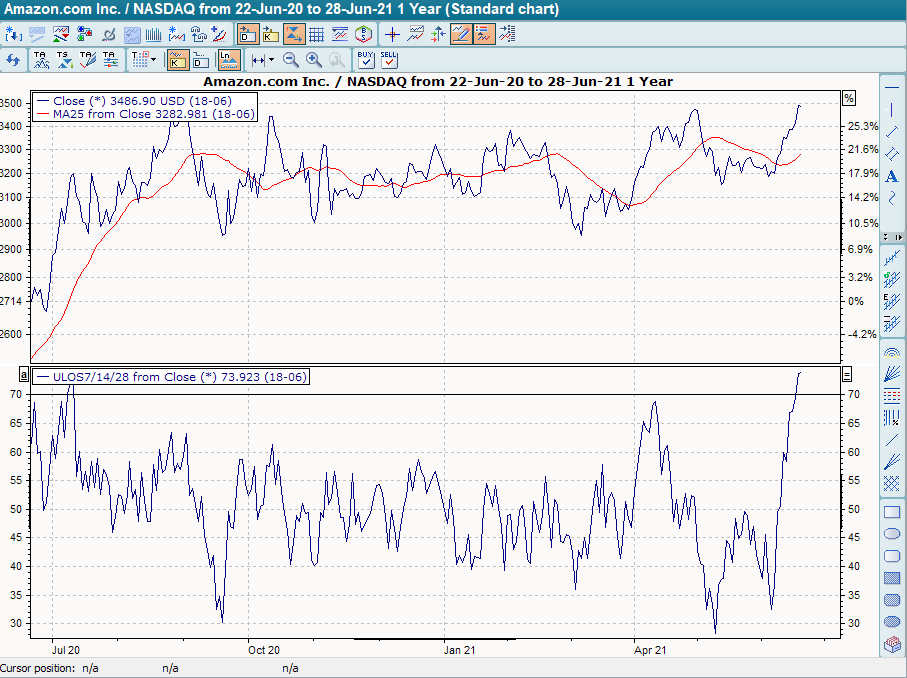
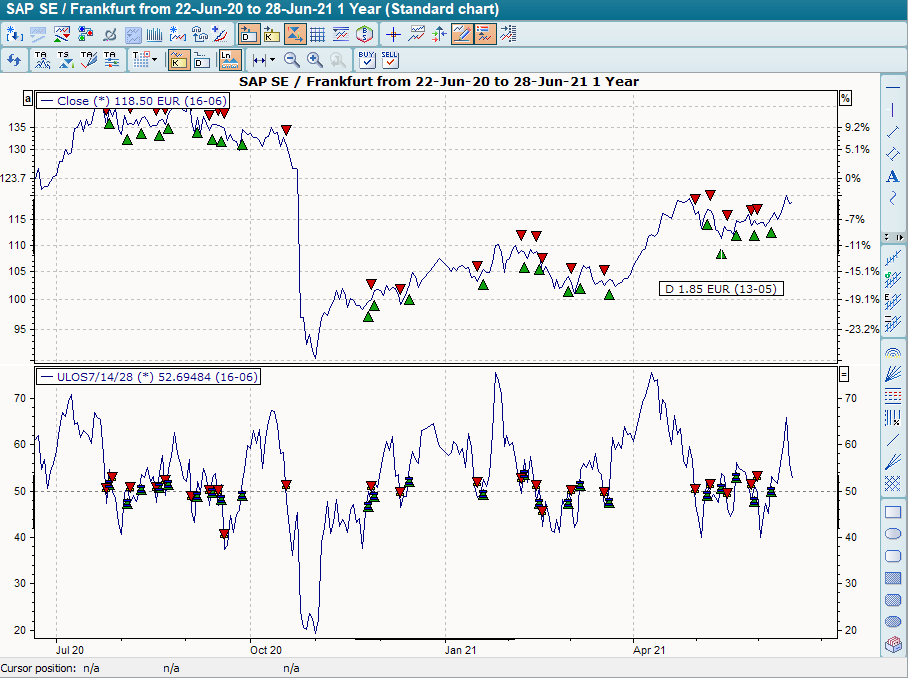
The first is the intersection with the center line. If the indicator crosses the midpoint line from bottom to top, this is a buy signal; if the indicator crosses the midpoint line from top to bottom, this is a sell signal.
Secondly, leaving extreme zones. The extreme zones are generally 30 and 65. Leaving the upper extreme range is a sell signal, leaving the lower extreme range is a buy signal.
And thirdly, the search for divergences. A negative signal is given when the underlying asset is still forming new highs, while the indicator is no longer forming new highs; a positive signal is given when the actual price trend is still forming new lows, but the indicator is no longer forming new lows.
Default setting
-
The three periods for the calculation are 7, 14 and 28 days. The extreme zones are applied at 30 and 65.
Basic trading systems
-
Ultimate Oscillator
The basic trading system "Ultimate Oscillator" uses the calculated time periods x, y and z with the standard setting of the indicator: 7, 14 and 28 days. The line at +50 is drawn as a signal line. The base trading system provides a buy signal when the indicator breaks the line at +50 from bottom to top and a sell signal when the indicator breaks the 50 from top to bottom.