Type
Oscillator
Short introduction
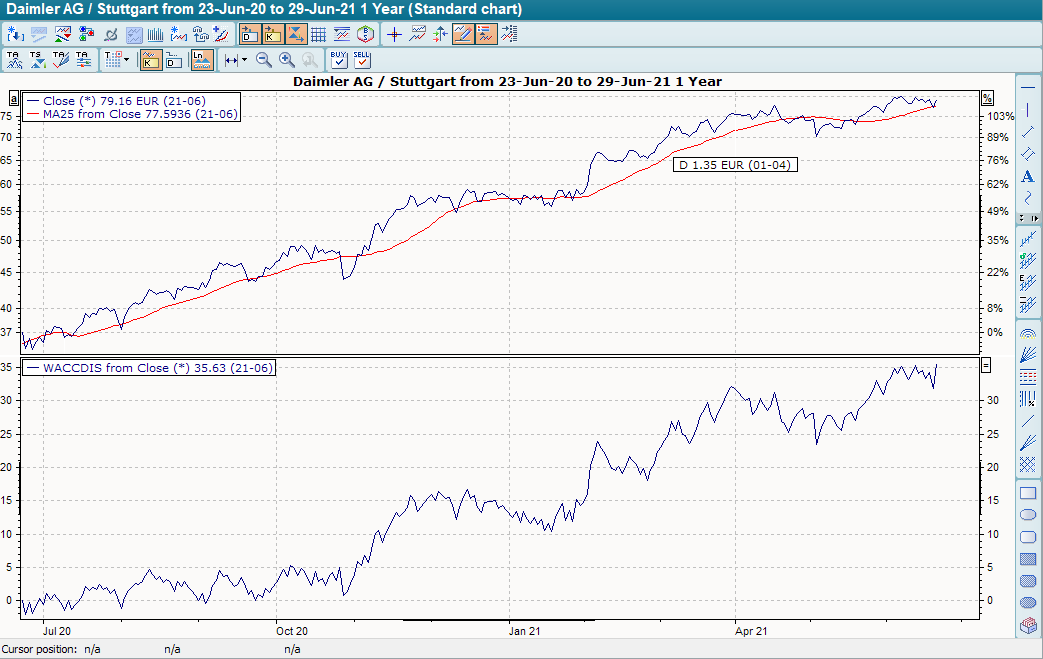
Larry Williams developed the Williams Accumulation/Distribution (WAD) to measure price changes. The aim of the indicator is to generate signals through divergences to the price trend.
Statement
As with other indicators, Williams not only refers to the prices of the current day to calculate the difference between the close and the daily low or high, but also includes the closing prices of the previous day in the calculation. In this way, a real high or real low can be identified. The sum of the individual price changes is added to the previous day's value day by day. This results in an upward and downward open indicator curve that fluctuates around the zero line. If the close prices of the last two days are the same, the indicator value does not change, as the value 0 is added to the old value.
Formula/calculation
ifCt >Ct-1 then X = C - TL
ifCt <Ct-1 then X = C - TH
ifCt =Ct-1 then X = 0
and
Williams A/D = (Xt +Xt-1 +Xt-s + ... +Xt-n+1)
where:
TL = "True Low", i.e. today's low or the previous day's closing price, whichever is the lower.
TH = "True High", i.e. today's high or closing price of the previous day, whichever is higher.
Interpretation
The actual object of investigation for the WAD is the change in prices, which is measured using the indicator. There are two possible interpretations:
Firstly, the search for divergences. A negative signal is given when the underlying asset is still forming new highs, while the WAD is no longer forming new highs; a positive signal is given when the actual price trend is still forming new lows, but the indicator is no longer forming new lows.
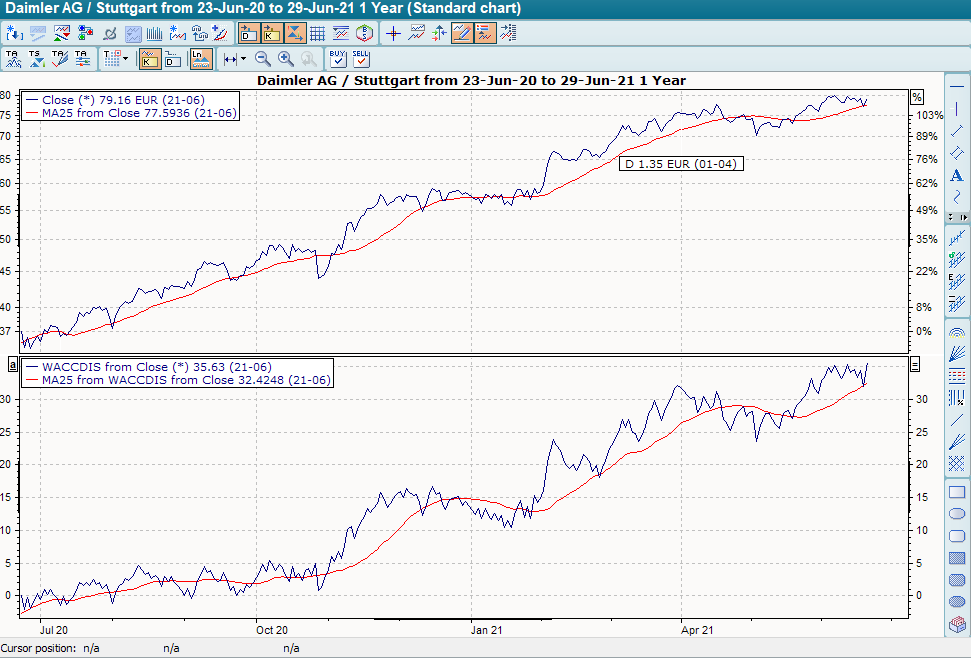
Another possibility is to calculate a GD on the WAD and use the intersection of the two lines as a signal generator. A buy signal is given when the WAD crosses its GD from bottom to top, a sell signal when the WAD crosses its GD from top to bottom.
Default setting
-
daily
Basic trading systems
-
Williams Accumulation/Distribution
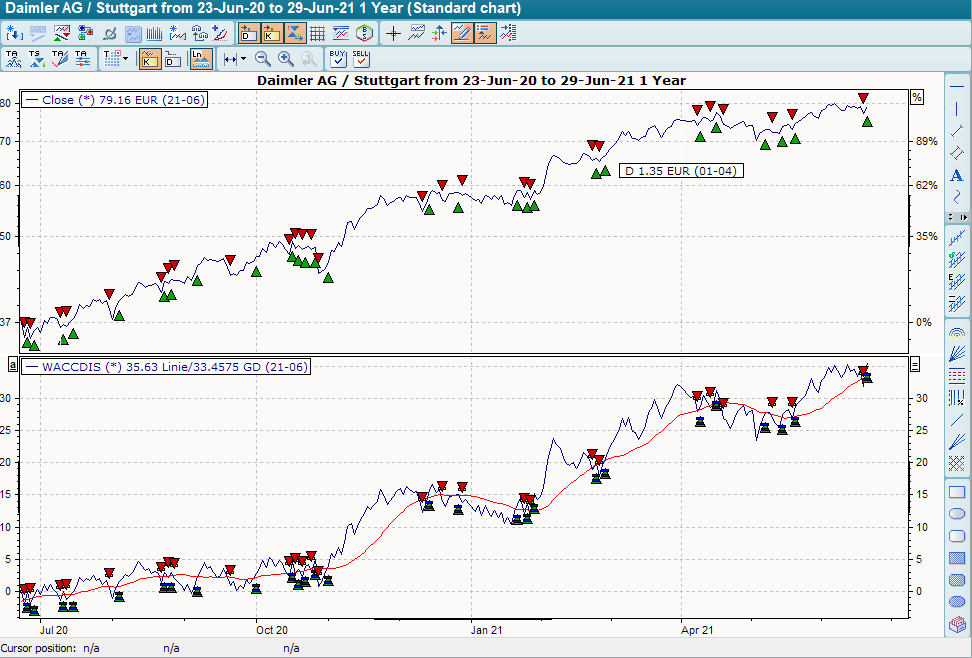
In its default setting, the basic trading system "Williams Accumulation/Distribution" provides trading signals when the indicator crosses its linear GD 20. It provides buy signals when the GD is broken from bottom to top and sell signals when the indicator breaks its GD from top to bottom.