Type
Oscillator
Short introduction
The True Strength Index (TRSI) developed by William Blau is a double-smoothed momentum index. In principle, it is a further development of the RSI, with which it also shares many characteristics and rules of interpretation.
Statement
The TRSI looks at individual price changes (via momentum) and smoothes them twice. A rising value therefore signals a rising price, while a falling value indicates a falling price. Thanks to double smoothing, all price outliers are almost completely filtered out.
The indicator is calculated by dividing a double-smoothed one-day momentum by the amount of a double-smoothed one-day momentum. This result is usually multiplied by 100, so that the curve fluctuates between -100 and 100.
Formula/calculation
TRSI = 100*((EMAx(EMAy(Mom1)))/EMAx(EMAy(abs(Momt))))
where:
EMAx = shorter exponential moving average
EMAy = longer exponential moving average
Interpretation
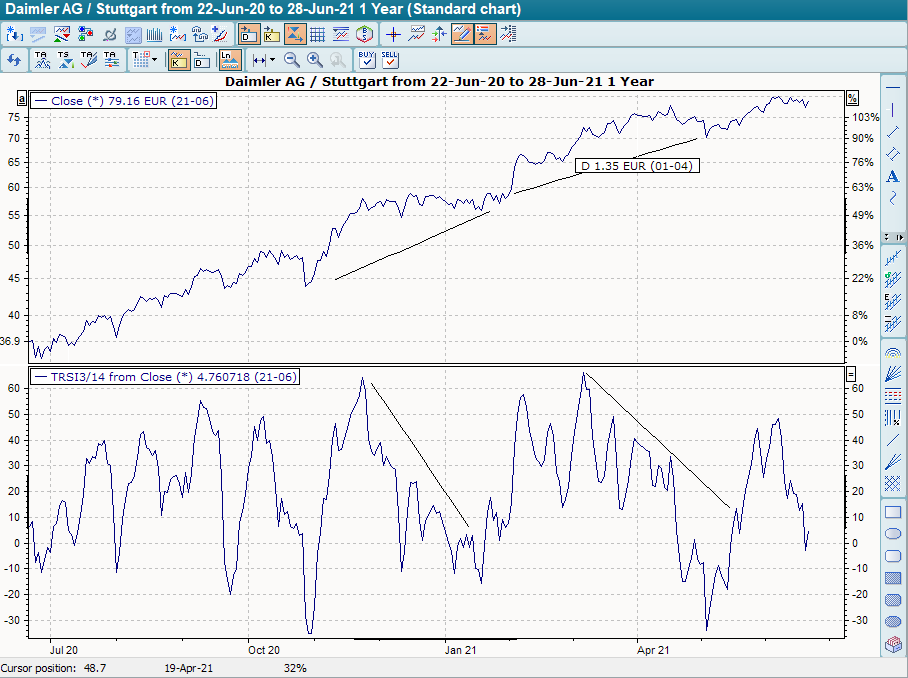
According to William Blau, the TRSI is primarily used to find trend reversals in the price trend. Therefore, one should primarily look for divergences between price and indicator.
A negative signal is given when the underlying asset is still forming new highs, while the indicator is no longer forming new highs; a positive signal is given when the actual price trend is still forming new lows, but the indicator is no longer forming new lows.
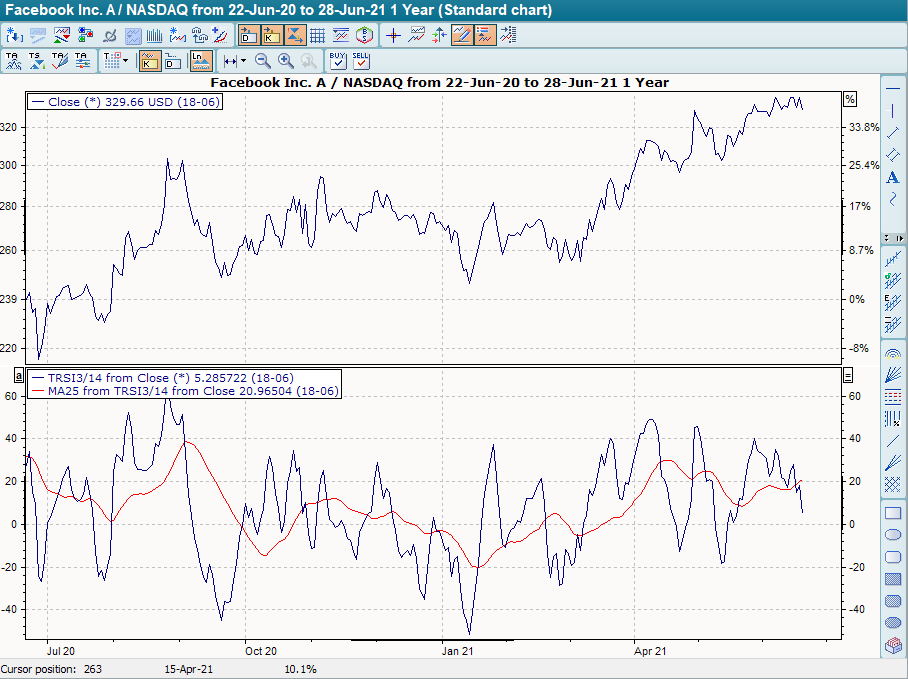
Another option is to calculate a GD on the TRSI and use the intersection of the two lines as a signal generator. A buy signal is given when the TRSI crosses its GD from bottom to top, a sell signal when the TRSI crosses its GD from top to bottom.
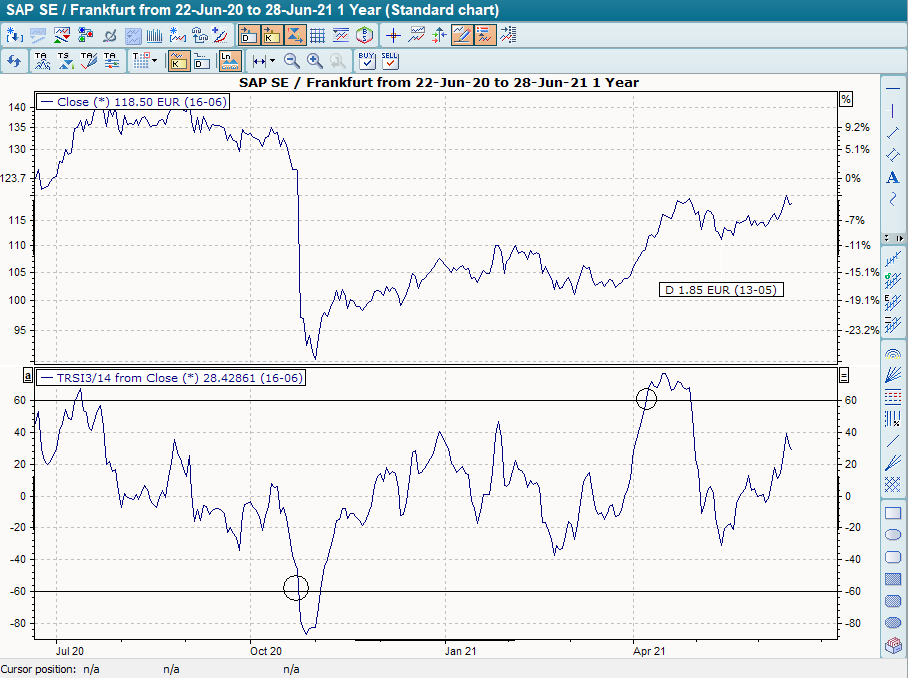
A third option, similar to the RSI, is to enter extreme zones, for example at 70 and -70. Leaving the upper extreme range is a sell signal, leaving the lower extreme range is a buy signal.
Please also note the information on the RSI.
Default setting
-
Quick adjustment: 6 days for the short GD, 20 days for the long GD
-
Medium setting: 20 days for the short GD, 40 days for the long GD
-
Slow setting: 40 days for the short GD, 80 days for the long GD
Basic trading systems
-
True Strength Index (TRSI)
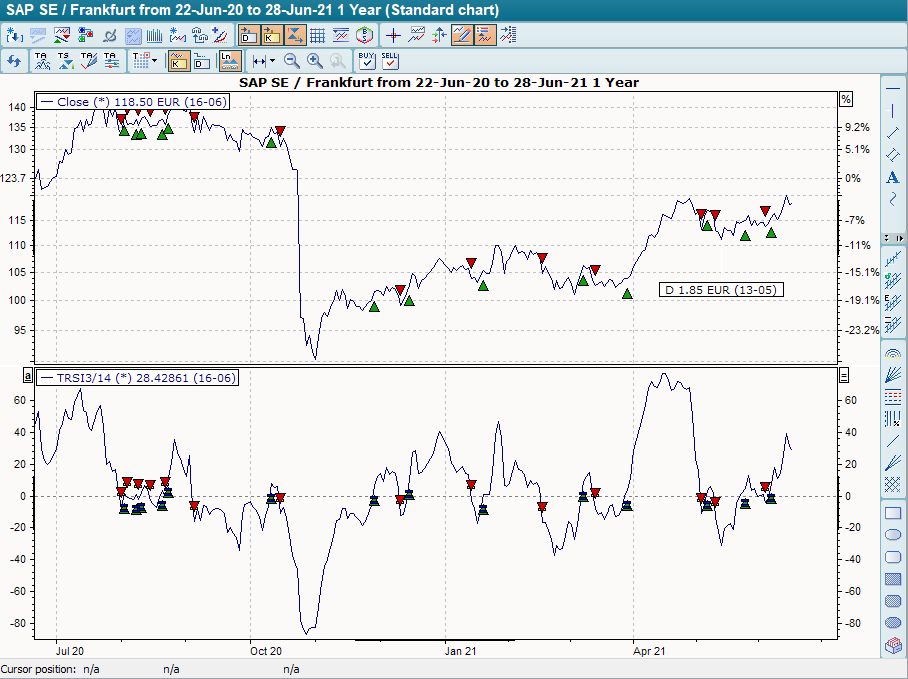
The basic trading system "True Strength Index (TRSI)" is set extremely quickly: For the short GD 3 days and for the long GD 14 days. It provides buy signals when the indicator breaks through the zero line from bottom to top, and sell signals when the indicator breaks through the zero line from top to bottom.