Proceed as follows to edit the timeline:
-
Select the TIME AXES command in the "Edit chart elements" menu icon on the "Chart" tab.
You can also double-click on the time axis in the chart window.
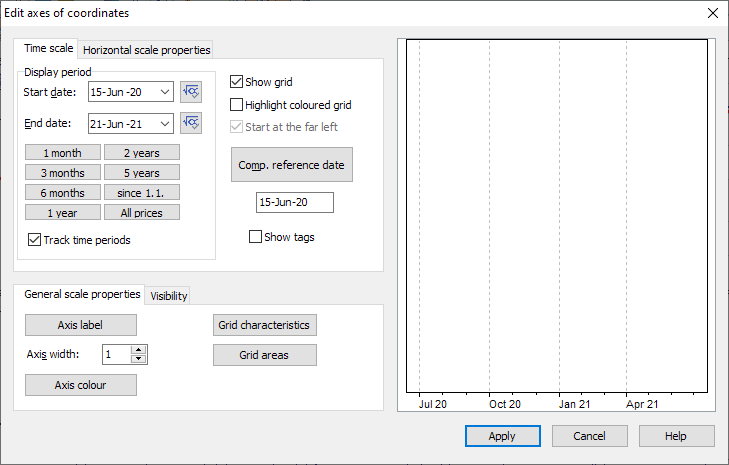
The "Edit coordinate axes" dialog box opens.
-
In this dialog box, the settings for the time axis are displayed on the "Time scale" tab. You can change these options by clicking on the fields or checkboxes.
Your settings are displayed immediately in the example window on the right-hand side so that you can check your changes. -
Save all changes with "Apply". To close the dialog window (without saving), select "Cancel".
Options in the "Edit coordinate axes" dialog box
|
Field |
Description |
|---|---|
|
Display period |
Click on the corresponding button to select the desired period. |
|
Carry time period |
This checkbox determines whether the period set under "Display period" is updated with the system date when reopening or updating (checkbox activated), or whether the start and end date always remain unchanged. This setting is generally not useful. |
|
Start date |
Here you select the start date manually. |
|
End date |
Here you select the end date manually. As a rule, you select the period with a mouse click from the options under "Display period". |
|
Set start date by formula |
Select the icon with the formula symbol to set the start date using a formula.
|
|
Reference date Cf. |
Here you define the date on which all time series defined in the chart as comparison and basis are equated, i.e. set to 100%. As a rule, this date corresponds to the start date of the chart. When the first comparison value is displayed, your Infront Portfolio Manager automatically sets the comparison basis to the start date. Activate the "Marker visible" checkbox to mark the reference date in the chart. |
|
Draw grid |
Deactivate this checkbox if you do not want the vertical guides (grid) to be displayed. |
|
Grid properties |
Specify the line properties and width of the grid. You can also specify the color of the grid here. |
|
Grid surfaces |
Define the properties of the surfaces here in the same way as the line properties. |
|
Axis labeling |
You can specify the font for the axis label in the familiar dialog box. |
|
Axle color |
You can specify the color of the axis in the following dialog box. |
|
Axle width |
You can select a different axis width, the width is displayed in points. |
|
Visibility |
On the small "Visibility" tab, specify which axes are to be displayed. You can also set the right-hand axis as the default here. |
The settings on the "Horizontal scale properties" tab can be found in the section Scale properties.
To change the display period, you can click in the time scale and move the axis to the left or right while holding down the left mouse button.