Type
Oscillator
Short introduction
The Relative Momentum Index was published in 1993 by Roger Altman, who worked on the optimization of the RSI and introduced a new parameter in the RSI calculation. Altman's starting point was the observation that the cause of timing problems with indicators is often to be seen in the fact that the observation period is insufficiently correlated with the price swing.
Formula/calculation
The RMI is calculated in the same way as the RSI. Altman increases the number of periods of the momentum under consideration from one in the RSI to a value of around five.
u = Max(Ct -Ct-m , 0 )
d = Max( - (Ct -Ct-m) , 0 )
U = ((n-1) *Ut-1+u) / n
D = ((n-1) *Dt-1+d) / n
RMI = 100 * U / ( U + D)
where:
U = average of the upward closing price moments of the last n days
D = average of the downward closing price moments of the last n days
m = period number for the momentum
Statement/Interpretation
The following literature is recommended for the statement and interpretation of the Relative Momentum Index:
-
Altman, Roger: Relative Momentum Index, Technical Analysis of Stocks & Commodities, 2/1993
-
Florek, Erich: New Trading Dimensions, FinanzBuch Verlag, 2000
-
Müller, Thomas and Lindner, Wolfgang: The big book of technical indicators, TM Börsenverlag
Default setting
-
n = 20
-
m = 5
Basic trading systems
-
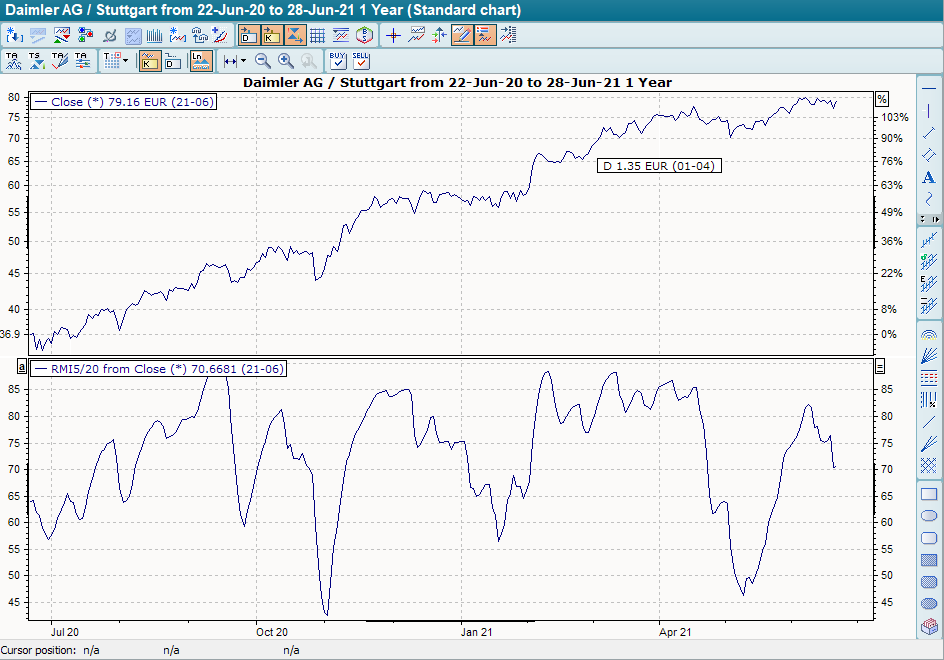
Relative Momentum Index
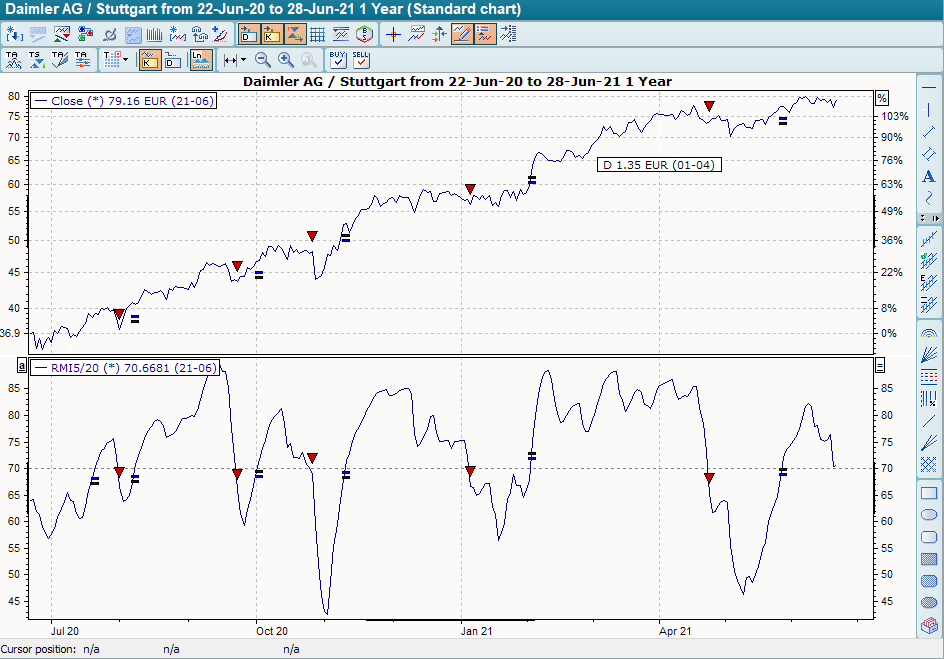
In the basic trading system "Relative Momentum Index (RMI)" the default setting for the period is 20 days and for the Mom period 5 days. It provides buy signals when the indicator breaks through the line drawn at +30 from bottom to top. These are closed out when the indicator crosses this line again from above. The base trading system, on the other hand, provides sell signals when the indicator breaks through the line at +70 from top to bottom. These are closed out when the indicator crosses this line again from below.