Type
Oscillator (short-term), trend follower (medium-term)
Short introduction
The Random Walk Index was introduced by E. Michael Poulos in 1991 and can be used as a short-term oscillator or medium-term trend indicator, depending on the evaluation period. According to Poulos' approach, price movements are made up of a trend component and a random component. Although the random walk is completely unpredictable, it can be characterized in two ways: a) A sequence of random movements can be expected to return to its starting point. b) The maximum expected distance from the starting point is proportional to the square root of the number of steps. The random walk index now compares the actual movement with the maximum expected radius based on random processes. Price determinations that do not fall within the limits of the random radius are thus regarded as a trend or an exaggeration, depending on the interpretation.
Formula/calculation
TrueRanget = Max(Ct-1,Ht ) - Min(Ct-1,Lt )
AvgTrRng(n) =MAn(TrueRange)
EXTH(n)t = (Ht -Lt-n) / (AvgTrRng(n+1) * SQRT(n))
EXTL(n)t = - (Lt - Ht-n) / (AvgTrRng(n+1) * SQRT(n))
RWIH = Max { EXTH(i) | i =nmin ..nmax }
RWIL = Max { EXTL(i) | i =nmin ..nmax }
where:
AvgTrRng(n) = linear average of the true range over n periods
SQRT(n) = square root of n
nmin ,nmax = minimum and maximum number of periods to be tested for the RWI
RWIH = RWI of Highs
RWIL = RWI of Lows
Statement/Interpretation
The following literature is recommended for the statement and interpretation of the Random Walk Index:
-
Poulos, E. Michael: Of Trends And Random Walks, Technical Analysis of Stocks & Commodities, 2/1991
-
Poulos, E. Michael: Futures According To Trend Tendency, Technical Analysis of Stocks & Commodities, 1/1992
-
Poulos, E. Michael: Are There Persistent Cycles?, Technical Analysis of Stocks & Commodities, 9/1992
-
Florek, Erich: New Trading Dimensions, FinanzBuch Verlag, 2000
-
Müller, Thomas and Lindner, Wolfgang: The big book of technical indicators, TM Börsenverlag
Default setting
-
short-term: n = 2 to 7 days
-
long-term: n = 8 to 64 days
Basic trading systems
-
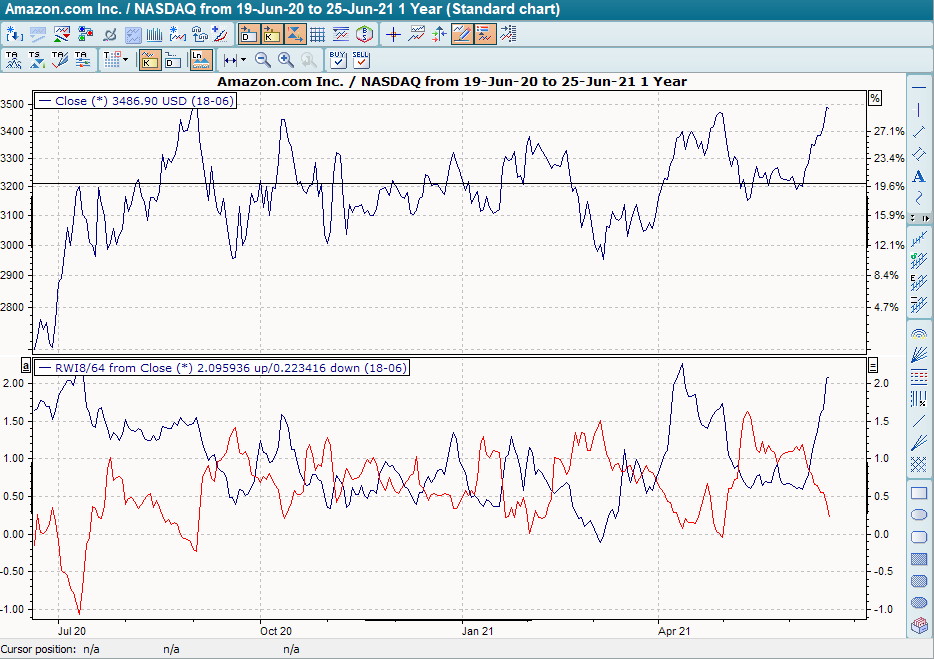
Random Walk Index (RWI)
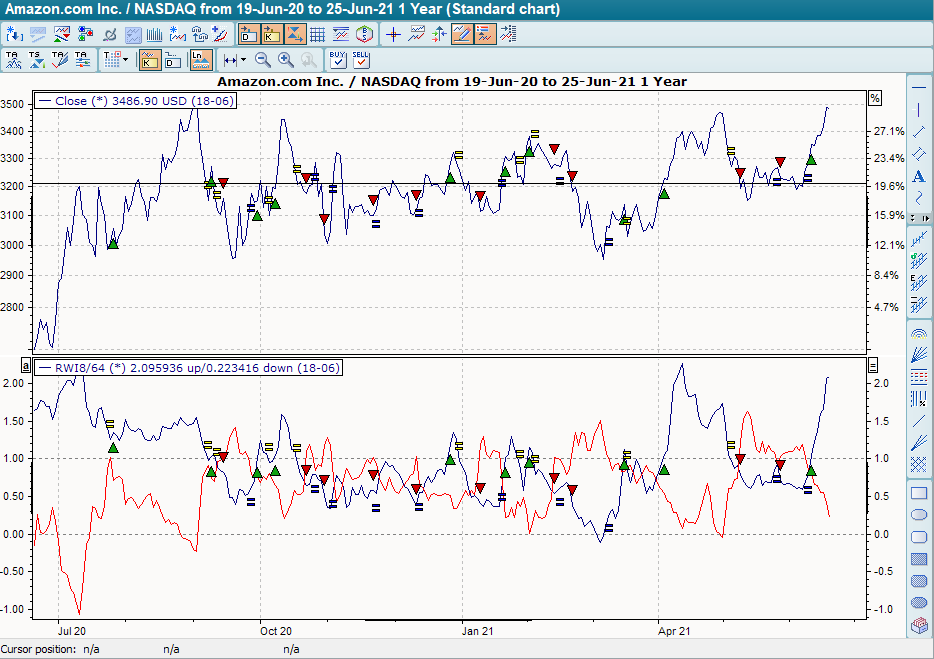
The basic trading system "Random Walk Index (RWI)" has a default setting of 8 at the bottom and 64 at the top. Two auxiliary lines are drawn at +1 and 0. The base trading system provides buy signals when the RWIH ("Random Walk Index of Highs" blue curve) rises to or above +1, while the RWIL ("Random Walk Index of Lows" red curve) is less than +1. It provides sell signals if the RWIH is less than +1, while the RWIL is greater than or equal to +1. The position is closed when the corresponding curve falls below +1 again.